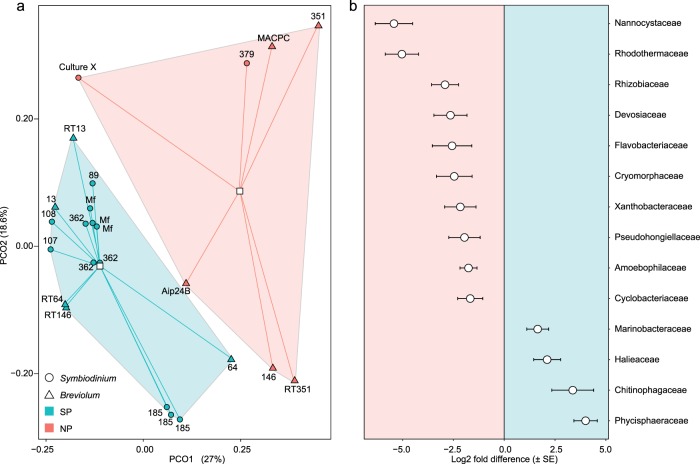
Fig. 1. Unconstrained ordination of OTUs and differential abundance of bacterial families in SP and NP cultures.
Principal coordinate analysis (a) of a Bray–Curtis dissimilarity matrix of all OTUs for SP (green symbols) and NP (red symbols) symbiodiniacean cultures belonging to the genera Symbiodinium (circles) and Breviolum (triangles). Centroids (white squares) are connected to points via lines. Significant Log2 fold differences (b) indicating which OTUs (summarised at the family taxonomic level) are of greater abundance in NP (negative Log2 values) and SP (positive Log2 values) cultures.

