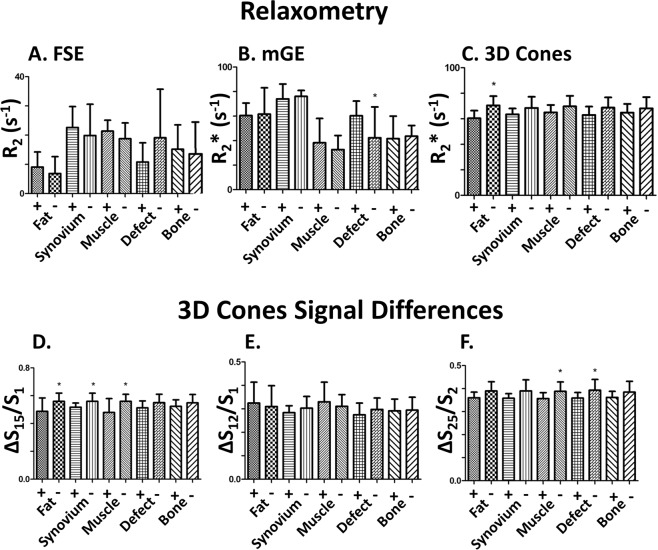
Figure 3.
Summary of the mean relaxivity rates (where the top of each bar indicates the mean) and standard deviations (indicated in one direction by the ‘T’ beyond each bar plot). These are listed for (A) R2 with FSE, (B) R2* with a Cartesian mGE, (C) R2* with multi-echo 3D Cones, and signal loss ratios of 3D cones between (D) the first and second echo, (E) the first and fifth echo, and the (F) the second and fifth echo. A plus ‘+’ indicates the measurements in joints injected with SPIOs; a negative ‘−’ indicates the lack of SPIOs; a star ‘*’ indicates if the t-test p-value was below 0.15.

