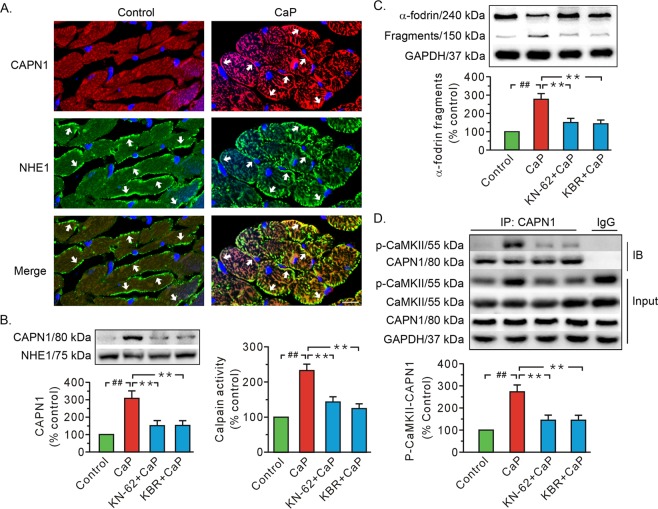
Fig. 2. Both KN-62 and KB-R7943 impeded calpain activation and the binding of CAPN1 to T287-phosphorylated CaMKII in the Ca2+ paradox.
a Representative immunofluorescence images showing CAPN1 membrane-positive cells in the Ca2+ paradox. Red, CAPN1; Green, NHE1, a positive control for plasma membrane protein; blue, nuclei. The arrows denote the positive signals of CAPN1 and NHE1 in the membrane. Scale bar, 10 μm. b Representative immunoblots for membrane CAPN1 proteins and densitometric analysis (left), along with grouped results of calpain activity (right). c Representative blots of full length and 150 kDa fragments of α-fodrin and grouped results of the densitometric analysis. d Representative immunoprecipitation and whole-cell lysate input for T287-phosphorylated CaMKII (p-CaMKII), CaMKII, and CAPN1, along with grouped analysis of T287-phosphorylated CaMKII–CAPN1 interaction. The CaP whole-cell lysates served as the input and normal IgG served as a negative control to pull-down the CAPN1 in the IgG group. NHE1 and GAPDH served as loading controls. Values (b, d) and the ratio of the fragments to total signal per lane (c) are expressed as the percentage of the control group. Each bar represents the mean ± SEM; n = 6 rats in each group. Western blots were performed in five independent biological experiments and for three technical replicates per sample. ##, **P < 0.01. CaP Ca2+ paradox, KBR KB-R7943, IB immunoblot, IP immunoprecipitation.

