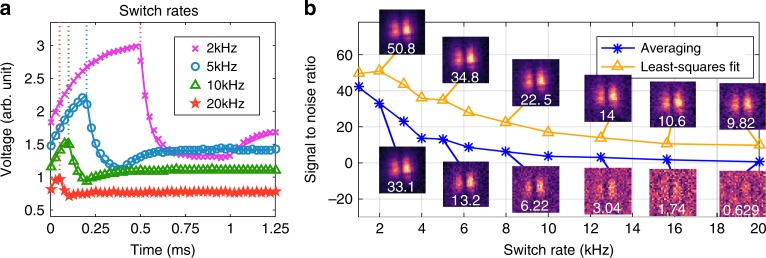
Fig. 3. Signal with switch rate.
a The measured voltage against time for different mask switch rates. The markers are the raw data and the solid lines are the fitted signals. The vertical dotted lines indicate when the first mask was changed for the different switch rates. Note that the data has been vertically offset for visual clarity. b Image signal-to-noise ratio (SNR) against mask switch rate where we have used the proposed least-squares fitting algorithm (yellow-triangles) and average over the mask duration (blue-asterisks) to estimate the mask values used in image reconstruction. See Supplementary Note 4 for definition and calculation of SNR. Images for 2, 5, 8, 12.5, 15.625 and 20 kHz switch rates are shown with their SNR in white. Note, the signals were acquired by fixing the delay line at the maximum of the electric field cycle.

