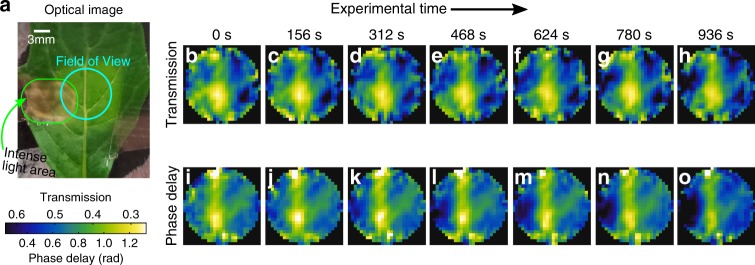
Fig. 5. THz leaf imaging.
a Optical image of the leaf, from an Achyranthes aspera plant, used in the experiment. The THz field-of-view is indicated here along with the area illuminated by an intense white-light source (~3 sun illumination). b–h (i–o) THz transmission (phase delay) of the leaf shown in part a at different points in time (experimental time shown on top). Note that the transmission images show an average from 0.3 to 0.8 THz, , and the phase delay images show the averaged unwrapped phase, , with the transmission colourscale been inverted. Further, the THz images have been deconvolved, using deconvblind function in Matlab R2016a, by calculating the point-spread function of our imaging system by Fourier optics.

