Fig. 2.
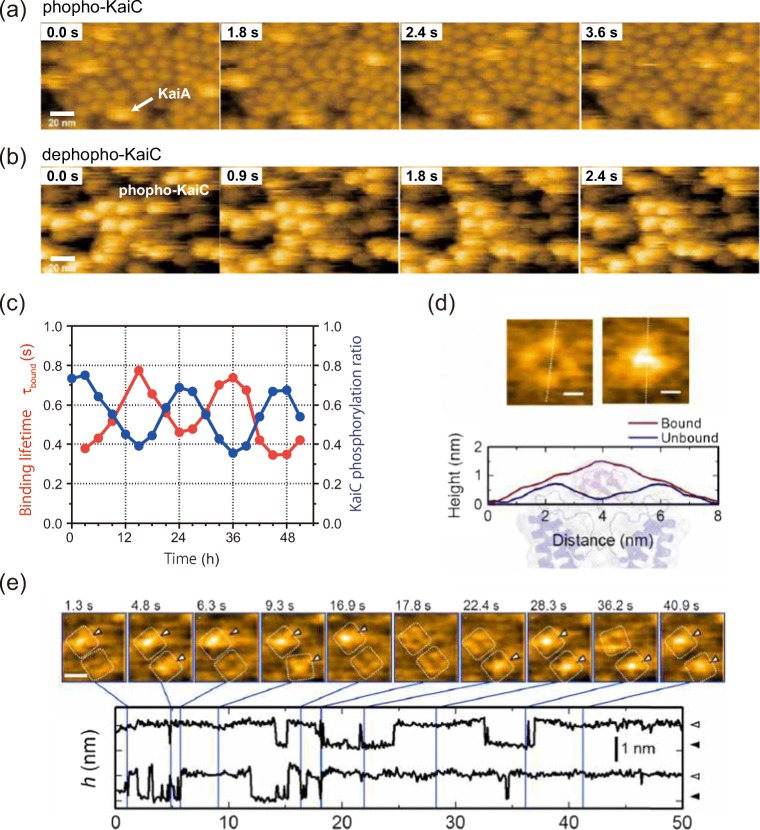
HS-AFM monitoring of intermolecular interactions. Binding of KaiA molecules to the CI side of a the KaiC phospho-mimics and b the KaiC dephospho-mimics. Frame rate, 10 fps. Scale bar, 20 nm. c KaiA’s bound state lifetime (τbound) depends on KaiCWT phosphostatus over a 51 h time course of the in vitro cycle of phosphorylation. d Typical AFM images of a KscA channel reconstituted in a DMPC bilayer with (right) or without (left) AgTx2. Height profiles along the white dotted lines in the AFM images are shown below the images. The background illustration behind the height profiles indicates the corresponding structures of the channel and AgTx2. e Time-lapse images of AgTx2 binding to and dissociation from the KcsA channels (top) and time courses of the averaged height h (nm) around the center of the extracellular surface of two corresponding K+ channels (bottom). White dotted squares represent regions of interest for visualization of the tetrameric channels. AgTx2 bindings onto the channels are indicated by white arrowheads on the AFM images. Frame rate, 10 fps. Scale bar, 5 nm

