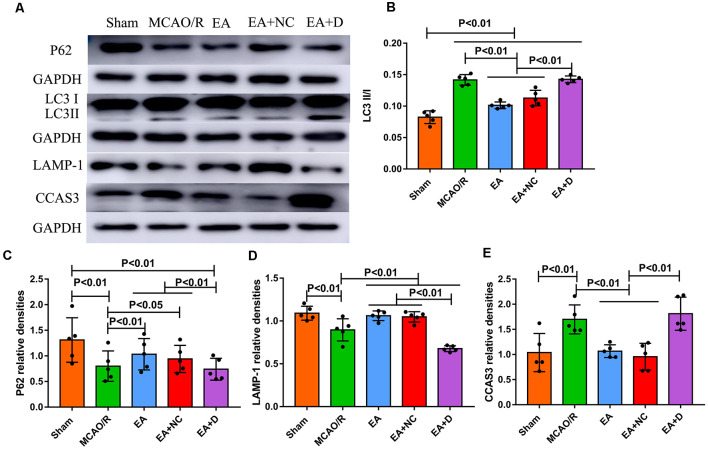
Figure 2.
Effect of electroacupuncture (EA) treatment on CCAS3 and autophagy-related proteins. (A) Western blot analysis of the expression levels of P62, LC3I, LC3II, LAMP-1, and CCAS3. (B) Bar diagram shows the difference of LC3II/I in the ipsilateral hippocampus of the rats (n = 5/group). (C) Statistical analysis showing the expression of P62 in the ipsilateral hippocampus of the rats. (D) Statistical analysis showing the difference of LAMP-1 in the ipsilateral hippocampus of the rats. (E) Statistical analysis showing the expression of CCAS3 in the ipsilateral hippocampus of the rats.

