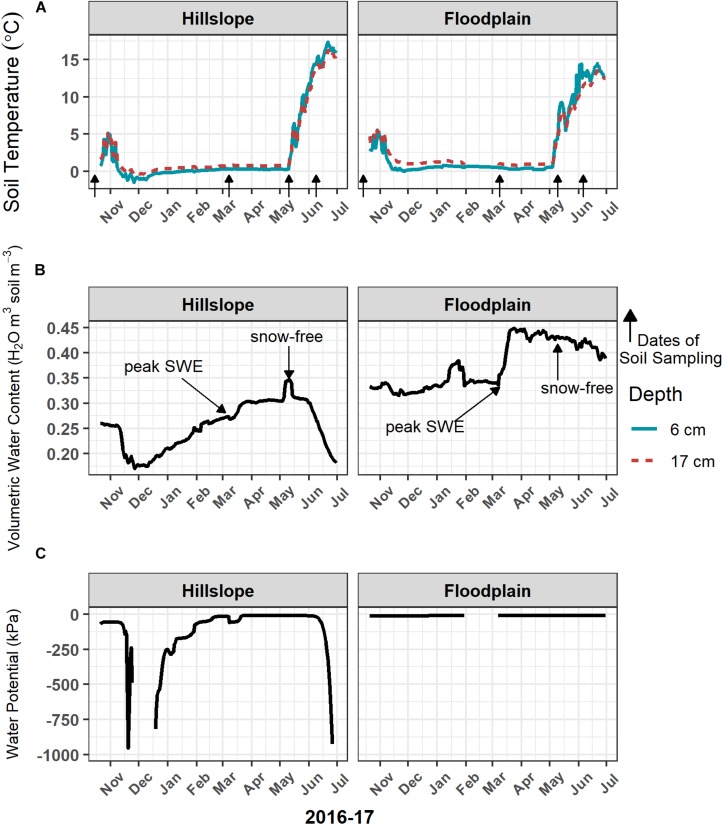
FIGURE 1.
Soil temperature (A) at 6 cm and 17 cm below the soil surface remained above 0°C when soils were covered with snow during winter. Loss of snow cover in May 2017 resulted in a rapid increase in soil temperature. The onset of snowmelt in March triggered a large increase in soil volumetric water content (B), as well as soil water potential (C), which lasted through early June 2017. Volumetric water content was measured at 9-cm depth and water potential was measured at 17-cm depth below the soil surface. Arrows indicate the dates of soil sampling.

