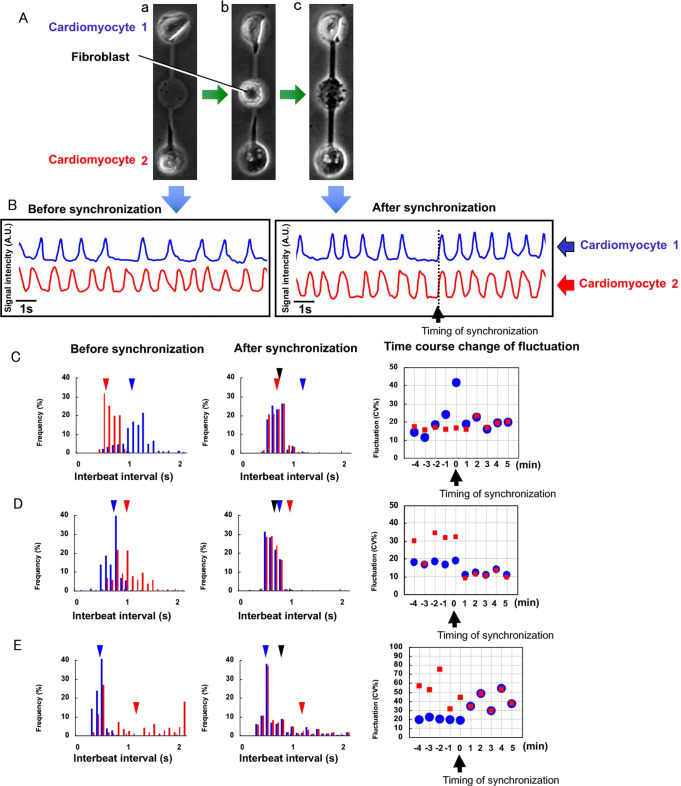
Fig. 7.
Synchronization of two cardiomyocytes through a fibroblast. (A) Micrographs of two cardiomyocytes under isolated conditions (a), when a fibroblast was added between two cardiomyocytes (b), and when two cardiomyocytes were connected through a fibroblast and synchronization started (c). (B) Beating waveforms at (a) and (c) in panel (A). (C)–(E) Three types of synchronization tendencies. Beating frequency spectrum before (left graphs) and after (center graphs) synchronization, and their beating fluctuation (right graphs). (C) Synchronization to a cell beating faster and more stably. (D) Synchronization and creation of new beating intervals contributing to beating stability. (E) Synchronization with new beating frequency, but beating fluctuation increased

