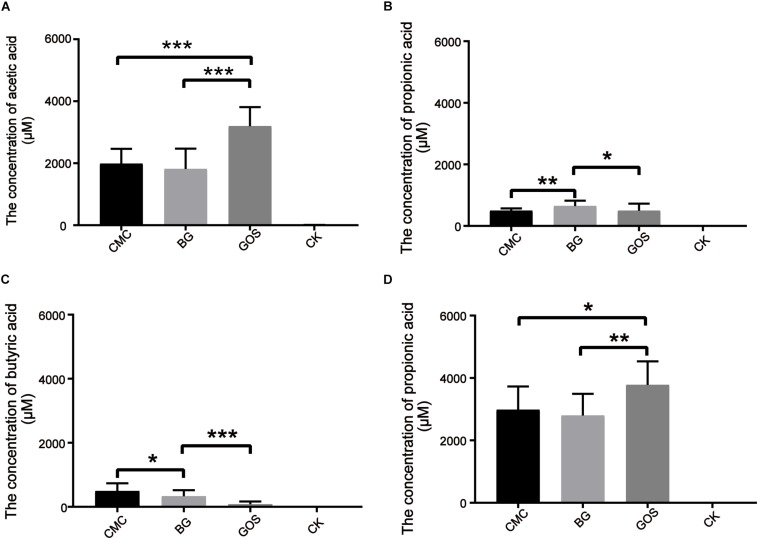
FIGURE 3.
Production of SCFAs after 24 h of in vitro fermentation. The figures represent concentration (μM) of acetic acid (A), propionic acid (B), butyric acid (C), and total SCFAs (D) in each treatment. Significant differences in the production of SCFAs in each treatment fermentation and the control were calculated using the paired t-test with *P < 0.05, **P < 0.01, and ***P < 0.001 compared to the control. Carboxymethylcellulose (CMC), β-glucans (BG), galactooligosaccharides (GOS), control (CK), short-chain fatty acids (SCFAs).

