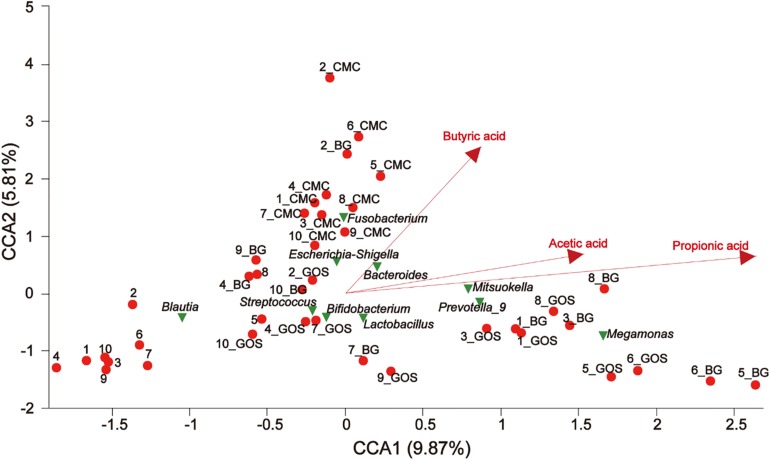
FIGURE 8.
The relationship between environmental factors, samples, and microflora. The dots of different colors or shapes in the figure represent sample treatments and genus level microbiota (top 10); the red arrow represents the quantitative environmental factor, and the length of the environmental factor arrow can represent the degree of influence of the environmental factor on the species data (interpretation). The size of the environmental factor arrow represents positive and negative correlation (sharp angle: positive correlation; obtuse angle: negative correlation; right angle: no correlation); projection from the sample point to the arrow of the quantitative environmental factor is the projection point distance. The distance of the origin represents the relative influence of environmental factors on the distribution of sample communities.

