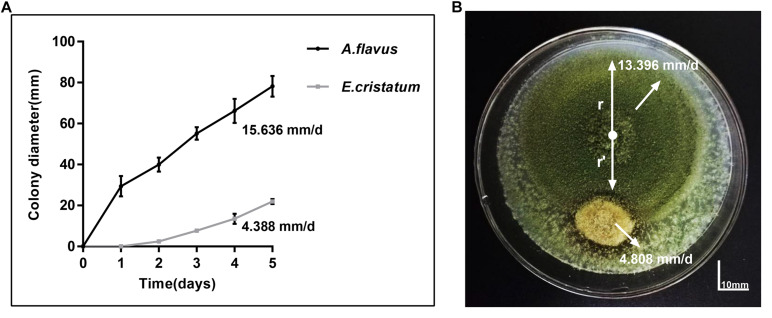
FIGURE 1.
Confronting incubation assay and growth curve for A. flavus and E. cristatum. (A) Growth curves of A. flavus and E. cristatum in PDA at 28 ± 2°C for 5 days. Data spots represent mean values of three determinations ± standard deviation. (B) A. flavus was inoculated at the center of the PDA plate and E. cristatum and sterile water (control) were inoculated at 25 mm from the center of the plate.

