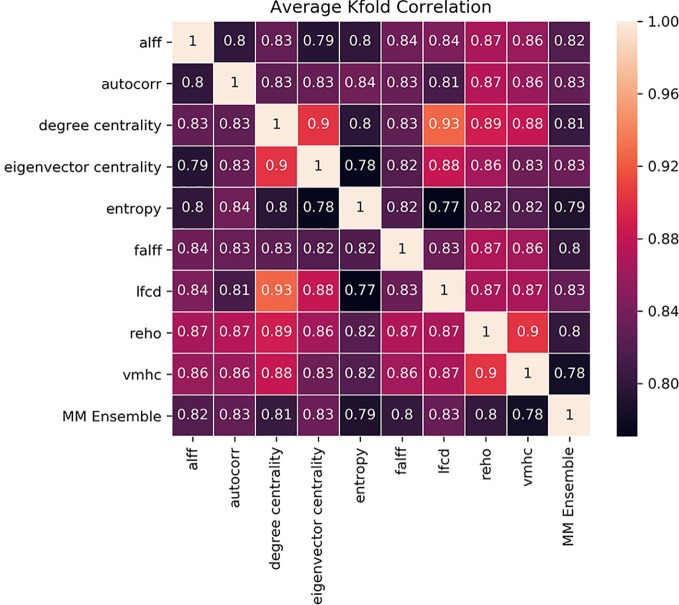
Figure 4.
Kendall-correlations between classification predictions between models trained and tested with different summary measures (SM-models) and between each SM-models and the MM-ensemble. The last column and the last row show the correlation between the predictions of each SM-model and the MM-ensemble. The correlation is made on the common test-dataset, calculated for each K-fold separately and then averaged for visualization purposes. The color coding is the Kendall-correlation averaged between K-folds.

