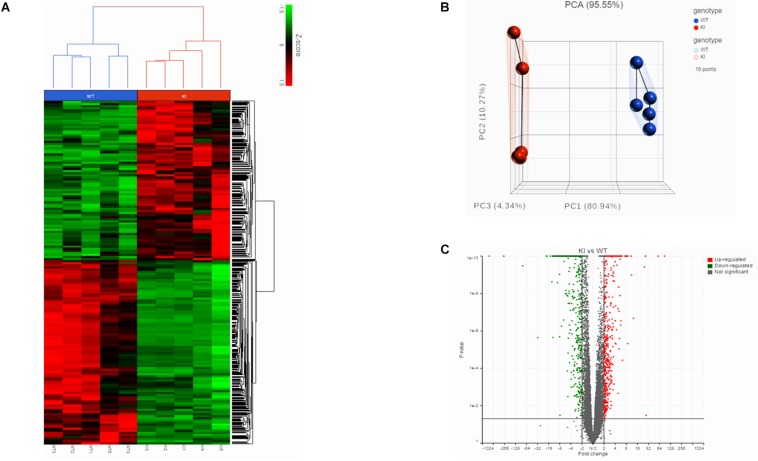
FIGURE 1.
Transcriptome analysis of germ cells from KI and WT mice. (A) Hierarchical clustered heatmap showing the expression patterns of significantly (fold change ≤–1.5 or ≥1.5; p < 0.05) DEGs. The red boxes indicate the up-regulated genes, and the green boxes indicates down-regulated genes. Colored bar represents the expression levels. (B) PCA plot showing clustered samples based on the KI and WT genotype. Each point represents replicate sample for each genotype. (C) Volcano plot (fold change vs P-value) showing 2624 DEGs from KI and WT group (n = 5 per group). Red dots represent up-regulated genes and green dots down-regulated genes in KI vs WT.

