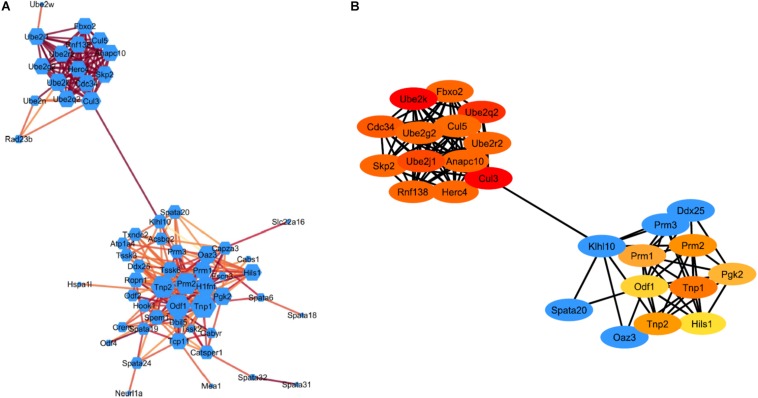
FIGURE 3.
STRING protein-protein interaction network. (A) Visualization of the PPI network of identified down-regulated DEGs from spermatogenesis process and UPP pathway. Colored nodes represent genes/proteins. Edges represent the protein-protein associations. Node size indicates node degree value and Edge color represents stringdb score. Darker edges mean higher stringdb score (B) Visualization of the top 20 hub genes from the PPI network using the cytoHubba plugin in Cytoscape software. Red to yellow colored nodes represents genes with high to low PPI degree scores.

