
FIGURE 2.
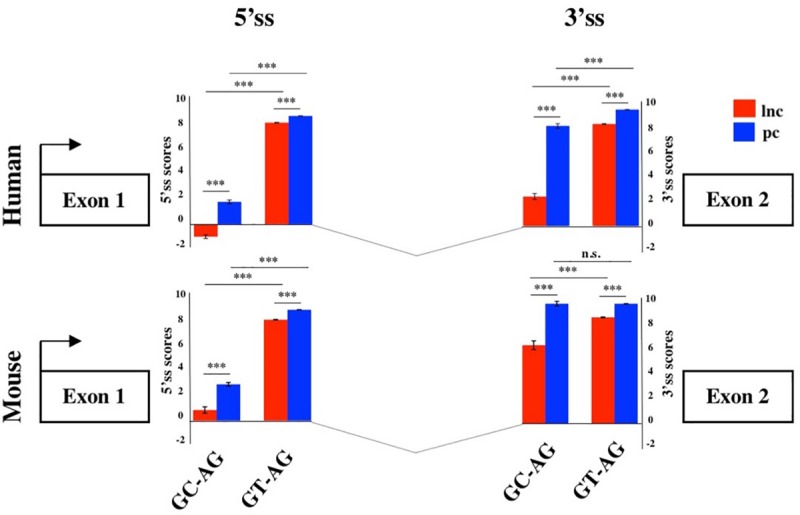
Splice junctions strengths of the first introns. Schematic representation of the average scores of 5′ and 3′ss strengths of long non-coding and PCGs in human and mouse. The strengths of 5′ and 3′ ss were calculated as weight matrix scores for GC-AG and GT-AG first introns. ***p < 0.001.