
FIGURE 5.
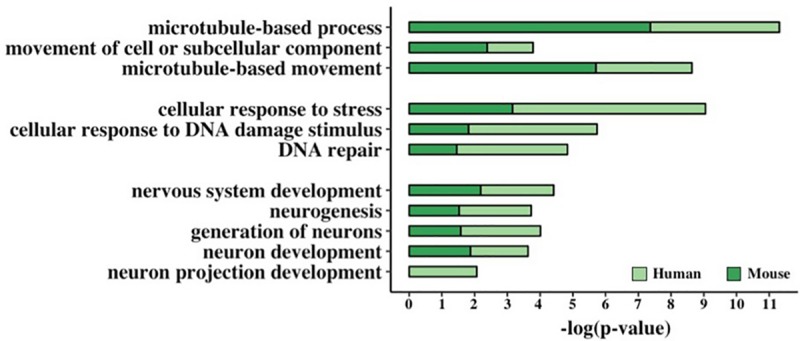
Functional enrichment analysis of GC-AG-containing genes. Bar graph representing the GO terms found significantly enriched in GC-AG containing PCGs. The GO term name is indicated on the Y-axis, and the (–)log10 of the p-values is indicated on the X-axis.