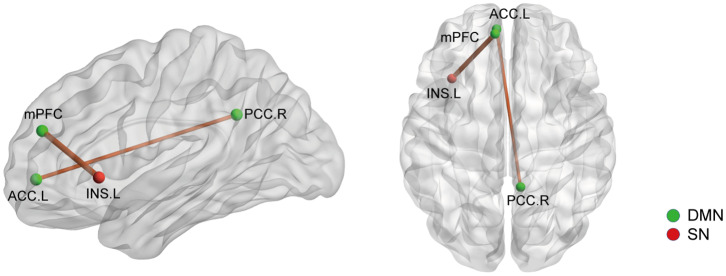
Figure 5.
The structural covariance (SC) differences between the AS patients and HCs based on significant FC changes (p < 0.05, Bonferroni corrected). Ball color indicates different brain network. The line width indicates the degree of differences (wider line means larger difference). DMN, default mode network; SN, salience network.

