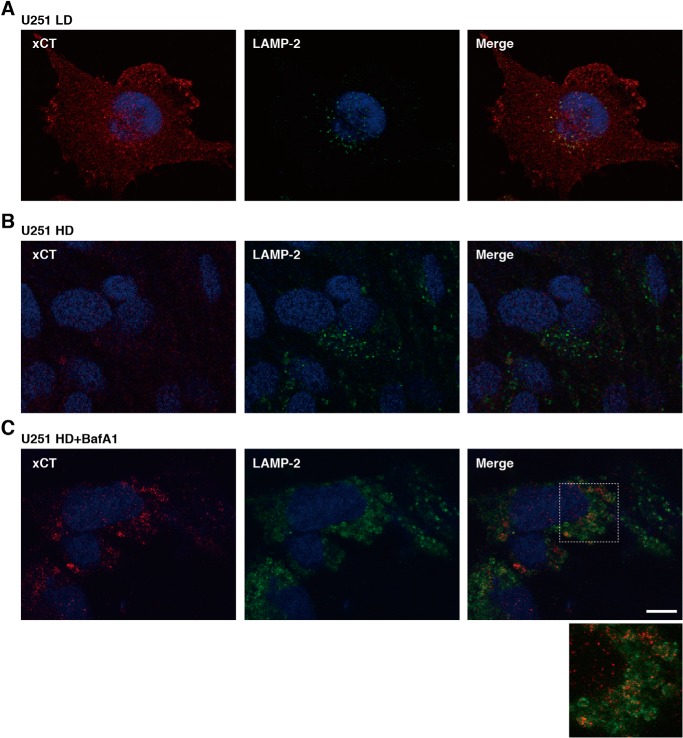
Figure 4.
Localization of xCT in U251 cells at LD and HD. A–C, confocal images of U251 cells cultured at LD (A) and HD (B) or treated with BafA1 (1 μm) at HD for 48 h (C). Cells were stained with anti-xCT (red) and anti-LAMP2 (green) antibodies. Nuclei were also stained with Hoechst 33258 (blue). Scale bar = 10 μm.

