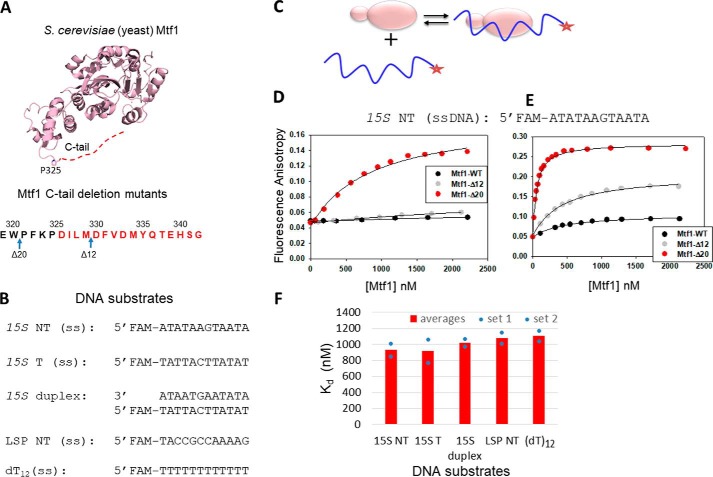
Figure 1.
The C-tail of Mtf1 drastically autoinhibits the DNA binding activity of Mtf1. A, structure of the yeast mitochondrial transcription factor Mtf1 (rose, PDB code 1I4W). The missing 16 aa of the C-tail of Mtf1 in the crystal structure are shown as a red dotted line and are also marked in red in the amino acid sequence of the C-tail of Mtf1. B, DNA sequences of the substrates used for the Mtf1 DNA binding studies. C, cartoon showing the basic scheme of the fluorescence anisotropy assays to monitor protein–DNA binding. D, representative binding curves showing the fluorescence anisotropy changes resulting from titration of the 15S NT DNA with Mtf1. 15S NT DNA (5 nm) was titrated with Mtf1-WT (black circles), Mtf1-Δ12 (gray circles), and Mtf1-Δ20 (red circles) in buffer A (see “Experimental procedures”). E, 15S NT (5 nm) was titrated with Mtf1-WT (black circles), Mtf1-Δ12 (gray circles), and Mtf1-Δ20 (red circles) in buffer A without potassium glutamate. The solid lines represent fit to the hyperbolic Equation 1 with Kd values as follows: Mtf1-WT = 447 ± 60 nm (amplitude, 0.059), Mtf1-Δ12 = 426 ± 33 nm (amplitude, 0.156), Mtf1-Δ20 = 51 ± 2.8 nm (amplitude: 0.24). F, the average DNA Kd values of Mtf1-Δ20 are shown for the DNA substrates in B. The blue dots are the individual values for set 1 and set 2 titration data, which are shown in Fig. S1.

