Figure 2.
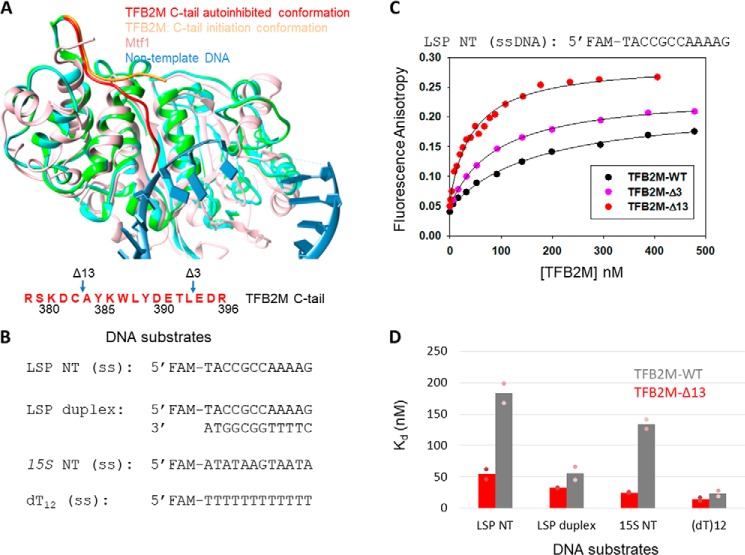
The C-tail of TFB2M mildly autoinhibits the DNA binding activity of TFB2M. A, the aligned structures of free human TFB2M (PDB code 6ERO, cyan), TFB2M in the initiation complex (PDB code 6ERP, green), and yeast Mtf1 (PDB code 1I4W, rose) are shown. The relative positions of the C-tail in all three structures are shown. The amino acid sequence of the C-tail of TFB2M is shown below in red. B, DNA substrates used for the TFB2M DNA binding studies. C, representative binding curves show the fluorescence anisotropy change resulting from titration of LSP NT (5 nm) with TFB2M-WT (black circles), TFB2M-Δ3 (pink circles), and TFB2M-Δ13 (red circles). The data were fit to the hyperbolic Equation 1 to obtain the following Kd values: TFB2M-WT = 169 ± 18 nm (amplitude, 0.17), TFB2M-Δ3 = 92 ± 3.3 nm (amplitude, 0.19), TFB2M-Δ13 = 46 ± 5.2 nm (amplitude, 0.23). D, the gray and red columns show the DNA Kd values of TFB2M-WT and TFB2M-Δ13, respectively, for the various DNA substrates shown in B. The pink dots represent individual values for set 1 and set 2 titration data, which are shown in Fig. S3.

