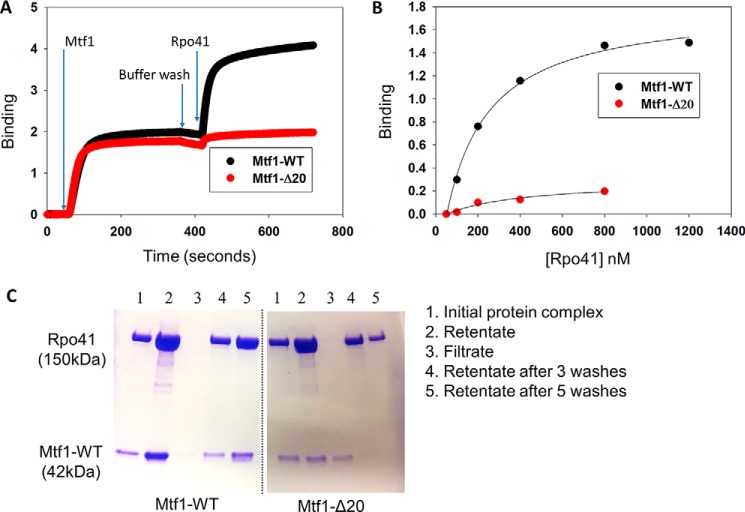
Figure 3.
The C-tail of Mtf1 mediates complex formation with Rpo41. A, representative binding plots showing complex formation between Mtf1 and Rpo41 using biolayer interferometry assays. The first 60 s represent the baseline. Over the next 300 s, the biosensor HIS1K was treated with 0.4 μm His-tagged Mtf1-WT (black line) or Mtf1-Δ20 (red line) protein, followed by washing with buffer for 60 s. The probes were then dipped in Rpo41 (0.5 μm) for 300 s, followed by washing for 60 s. B, the degree of binding (y axis) was calculated from the difference in light interference values before and after adding Rpo41 in A. C, an equimolar complex of Rpo41 and Mtf1-WT or Mtf1-Δ20 at a final concentration 2 μm (lane 1) was filtered through a 100-kDa molecular mass cutoff Microcon centrifugal filter unit. Lane 2 is the retentates, and lane 3 is the filtrates. The retentate was washed with 500 μl of buffer three times (lane 4). The retentate was washed two more times (lane 5). Samples of the initial protein complex, retentate, filtrate, and retentate samples after washing were run on a 4%–20% SDS-PAGE gel.

