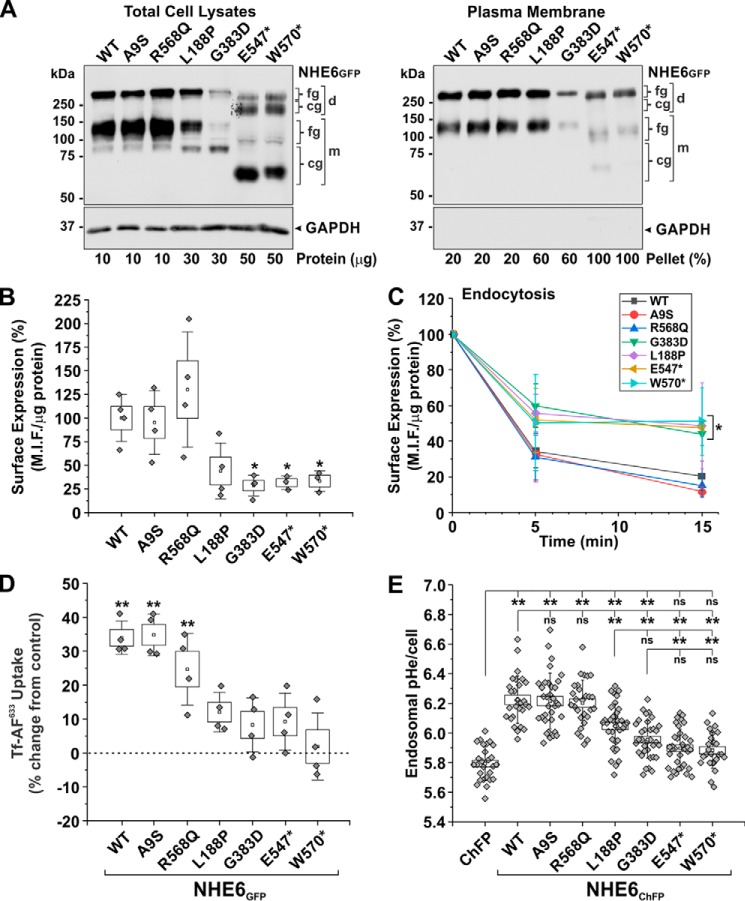
Figure 9.
Assessment of the functional properties of NHE6 variants. A, biochemical determination of plasma membrane trafficking of NHE6GFP WT or CS-linked variants using a cell-surface biotinylation assay. Cell-surface proteins were labeled with N-hydroxysulfosuccinimidyl–SS–biotin in AP-1 cells expressing the NHE6GFP constructs after 48 h. Total-cell lysates (left panel; protein loading ranged from 10 to 50 μg of protein per sample as indicated below the blot) and biotinylated fractions (right panel; representing 20–100% of plasma membrane proteins extracted per sample) were examined by Western blotting with polyclonal anti-GFP and monoclonal anti-GAPDH antibodies. Representative blots from three experiments are shown. B and C, surface expression and endocytosis of external triple flag tag–labeled NHE6 (3FNHE6HA) constructs in transiently transfected (48 h) AP-1 cells using a cell-based ELISA. Mean intensity fluorescence (M.I.F.) units were determined as a function of the cellular protein concentration and then normalized as percentage (M.I.F. units for WT (100%): 25,100 ± 6,348, n = 4). The surface expression of each construct at time 0 min (before the start of internalization) is charted in B (n = 3–4 experiments). Significance from WT-expressing cells was determined using a one-way repeated measures ANOVA (F value = 463.3, p value = 0.0022), with a post hoc Dunnett's test; *, p < 0.05. Percentage internalization of NHE6 constructs normalized to the zero time point are presented in C and represent the mean ± S.D. (n = 3–4 experiments). The NHE6 variants clustered into two groups: 1) WT, A9S, and R568Q, and 2) L188P, G383D, E547*, and W570*, with variants within each cluster yielding similar statistical values. Significance from WT cells at the 5- and 15-min time points was determined using a one-way ANOVA (F value = 9.43, p value = 4.48 × 10⁻⁵), with a post hoc Tukey test; ★, p < 0.05. D, transferrin uptake in HeLa cells transiently transfected (48 h) with GFP or NHE6GFP constructs. The initial uptake (5 min) of Alexa 633–conjugated transferrin (Tf-AF633) was measured in 1 × 10⁴ GFP-positive HeLa cells per experiment by flow cytometry (M.I.F. units for GFP control: 10,204 ± 1554, n = 4). Data were normalized as a percentage and displayed as percent change from GFP control cells. Significance from control cells was determined using a one-way repeated measures ANOVA (F value = 320.7, p value = 3.8 × 10⁻⁴), with a post hoc Dunnett's test; ★★, p < 0.001. E, recycling endosomal pH (pHe) was measured in AP-1 cells in the absence or presence of transiently transfected (48 h) NHE6ChFP constructs by fluorescence ratio image analysis of the internalized pH-sensitive probe FITC-conjugated human transferrin (Tf–FITC). Data represent the average endosomal pHe per cell pooled from three separate experiments (8–12 cells per construct/experiment; n = 24–36). Significance was determined by one-way ANOVA (F value = 40.02, p value = 0), with a post-hoc Tukey test; ★★, p < 0.001. Data in B, D, and E are plotted as box charts, with the central white square indicating the mean; the box representing the S.E.; and the error bars showing the S.D. fg, fully-glycosylated; cg, core-glycosylated; d, dimeric; m, monomeric.

