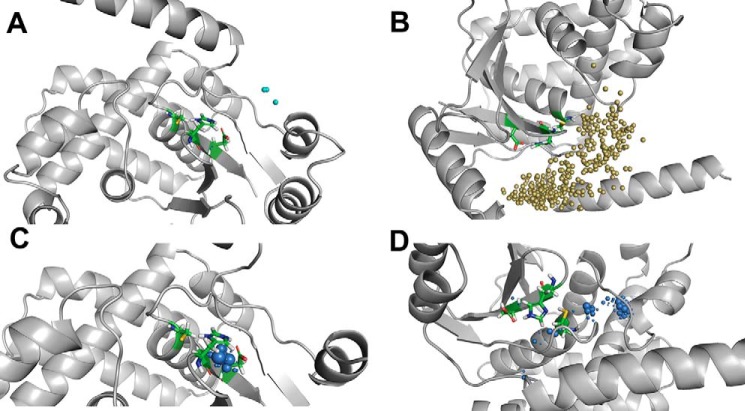
Figure 6.
Water trajectory analysis of ubiquitin-bound OTUB1 structures. Top panels, water inlets to the catalytic site for incoming and outgoing water molecules. Bottom panels, local distribution density of water molecules to identify stable water molecules. A and C, charged state of catalytic residues O1U1C. B and D, neutral state of active-site O1U1N.

