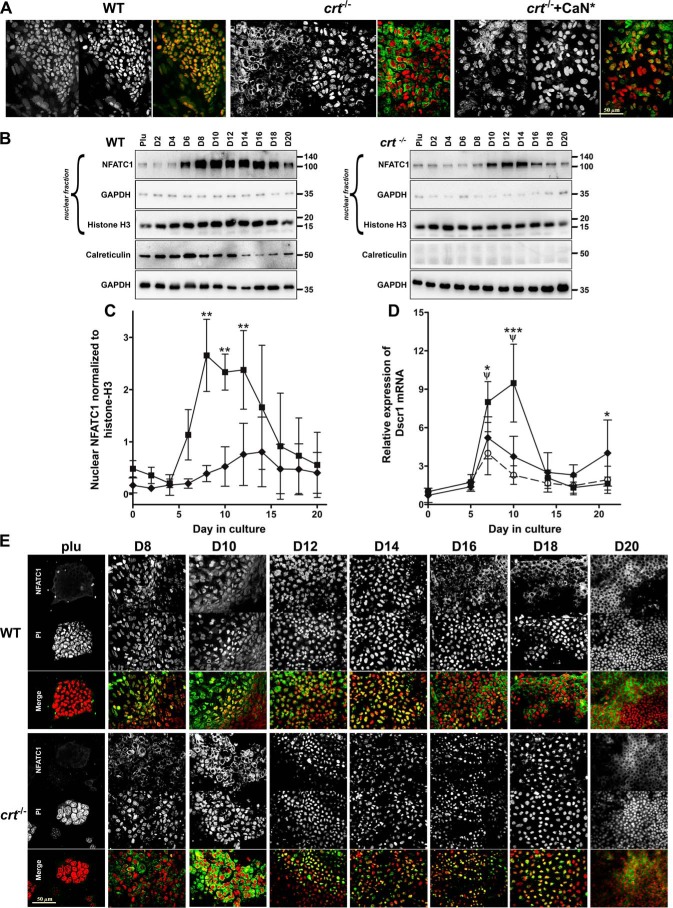
Figure 3.
Calreticulin regulates NFATC1 nucleocytoplasmic trafficking. A, confocal immunofluorescence localization using NFATC1 antibody on WT control, crt−/−, and crt−/−+CaN* ESCs on day 10 of the osteoblast differentiation protocol. Dual-channel grayscale images of a single field are displayed with NFATC1-labeled cells in the left panel, PI-labeled nuclei in the right panel, and the RGB panel of a merged image of green (NFATC1) and red (PI) where yellow indicates overlap. Scale bar, 50 μm. B, Western blot analysis of nuclear fractions of WT control and crt−/− ESCs undergoing osteoblast differentiation through time using NFATC1 antibodies and antibodies for GAPDH and histone H3 as cytosolic and nuclear markers, respectively. Shown are expression of calreticulin and (below) GAPDH from whole-cell lysates of WT and crt−/− cells undergoing osteoblast differentiation. C, the graph is a quantitative representation of the density of the Western blotting bands of nuclear NFATC1 normalized to nuclear histone H3 of three experiments. Shown are WT (■) and crt−/− (♦) ESCs. Shown is RT-qPCR analysis of the NFATC1 target gene Dscr1 (D) through time of differentiation in DMSO-treated WT (■) or crt−/− (♦) ESCs or WT ESCs treated with A-285222 (○) for days 6–17. Data are expressed as means ± S.D. (error bars), n ≥ 3; two-way ANOVA. C, p < 0.0001, F = 65.09. D, transcript levels of Dscr1 between WT control and crt−/− ESCs, p = 0.0304, F = 4.929; WT control ESCs treated or not with A285222, p < 0.0001, F = 47.5. Bonferroni post hoc analysis was as indicated (C and D): ***, p < 0.001; **, p < 0.01; *, p < 0.05; ψ, p < 0.001 for DMSO-treated WT versus A-285222–treated WT ESCs (D). E, confocal immunofluorescence localization analysis of NFATC1 trafficking in WT control and crt−/− ESCs throughout the differentiation timeline. Dual-channel grayscale images of a single field are displayed with the top rows showing NFATC1 immunolocalization, PI-labeled nuclei in the middle row, and the merged RGB images in the bottom rows. Scale bar, 50 μm.

