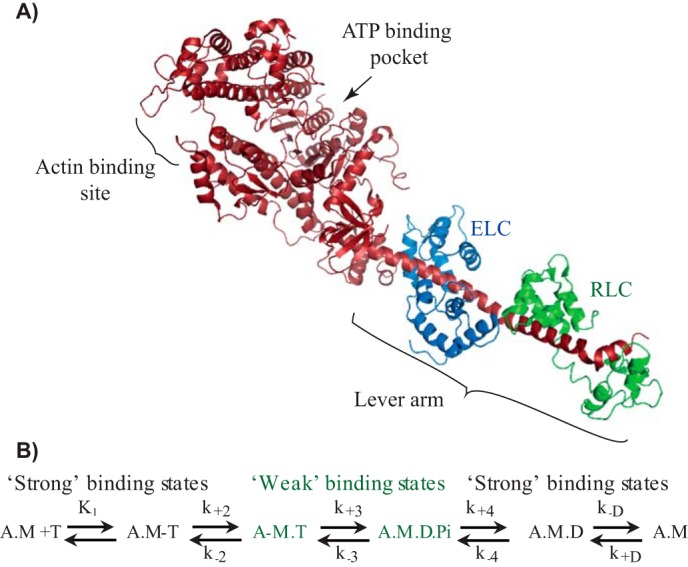
Figure 1.

Myosin S1 structure and ATPase cycle. A, crystal structure of scallop myosin II-subfragment-1 (Protein Data Bank code 1SR6) (62). The myosin heavy and light chains are shown as a ribbon diagram; S1 is indicated with the key parts of the motor domain. B, kinetic scheme for actomyosin ATPase. Myosin II with different nucleotide states is illustrated: A, actin; M, myosin; T, ATP; D, ADP; Pi, Pi. Strong and weak interaction states of myosin with actin are labeled in black or green, respectively. Rate constants for forward and reverse reactions are indicated as k+n and k−n, respectively.
