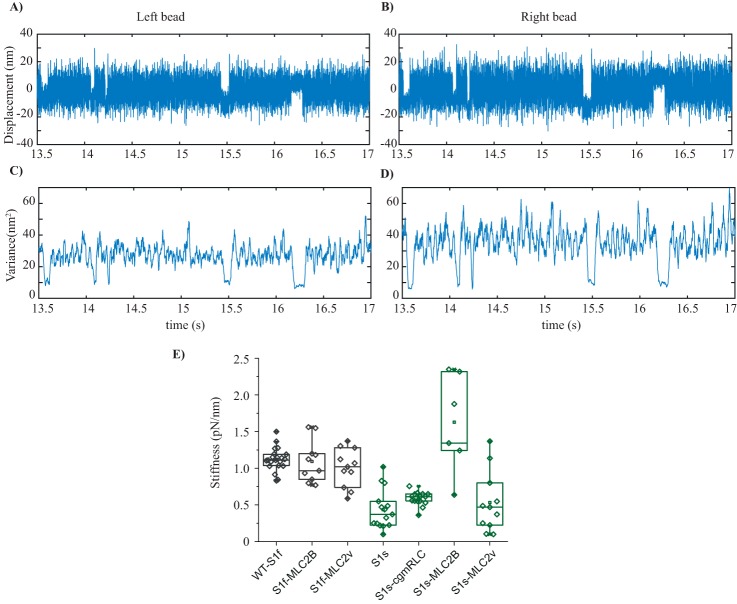
Figure 6.
Stiffness. A and B, original data records acquired in optical trapping experiments. Bead position is plotted over time for both the left and right bead of the dumbbell. Positive position feedback was used to increase the amplitude of thermal fluctuations, which effectively increased the variance ratio between binding events and free dumbbell noise for both traps in the direction of the actin filament axis. C and D, variance versus time plotted for the records shown in A and B. Variance was calculated for a rolling window of 20 ms, at our sampling rate of 10 kHz. For the example shown here, the variance-Hidden-Markov method yielded a combined trap stiffness of 0.078 pN/nm and a myosin head stiffness of 0.85 pN/nm. E, box plot with overlapped data points, the stiffness measured for WT-S1f, WT-S1s, and chimeric motors. Each rhombus represents the measured stiffness from individual myosins. Average stiffness with S.D. was as follows: for WT-S1f, −1.12 ± 0.03; for S1f-MLC2B, −1.24 ± 0.09; for S1f-MLC2v, −1 ± 0.07; for WT-S1s, −0.437 ± 0.08; for S1s-cgmRLC, −0.585 ± 0.024; for S1s-MLC2B, −1.62 ± 0.27; for S1s-MLC2v, −0.533 ± 0.11. Unpaired t test was used to calculate the statistical significance. WT-S1f (n = 20) and WT-S1s (n = 13) displayed statistically significant difference with p < 0.0001. No statistically significant difference between WT-S1f and S1f-MLC2B (N = 12, p = 0.72) or WT-S1f and S1f-MLC2v (N = 15, p = 0.128) was found. For WT-S1s and S1s-cgmRLC (N = 10), marginal but statistically significant difference was found (p = 0.0493). For WT-S1s and S1s-MLC2B, N = 6 and p < 0.0001. For WT-S1s and S1s-MLC2v, n = 11 and p = 0.4735. N = number of individual motor molecules.

