Figure 1.
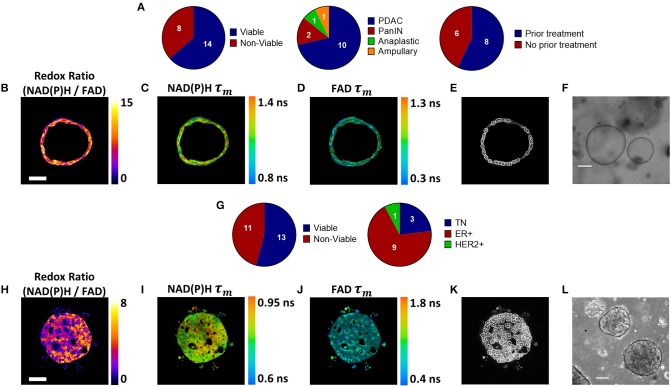
Patient-derived tumor organoid generation and optical metabolic imaging. (A) Pie charts depicting the success rate for generating viable organoids from patient pancreatic lesions (left), the distribution of PDAC, PanIN, anaplastic cancer, and ampullary cancer among successfully generated organoids (center), and the distribution of previously treated vs. untreated tumors among successfully generated organoids (right). Representative redox ratio (B), NAD(P)H τm (C), and FAD τm (D) images of an untreated pancreatic organoid taken 6 days after surgical resection (Patient PC14). Scale bar is 50 μm (E). Masks of individual cell cytoplasms overlaid onto NAD(P)H intensity image (F). Representative brightfield image of pancreatic organoids (Patient PC14). Scale bar is 200 μm. (G) Pie charts depicting the success rate for generating viable organoids from patient breast tumor biopsies (left), and the distribution of receptor subtypes among successfully generated organoids (right). Representative redox ratio (H), NAD(P)H τm (I), and FAD τm (J) images of an untreated breast cancer organoid taken 30 days after biopsy (Patient BC9). Scale bar is 50 μm. (K) Masks of individual cell cytoplasms overlaid onto NAD(P)H intensity image. (L) Representative brightfield image of breast cancer organoids (Patient BC9). Scale bar is 200 μm.

