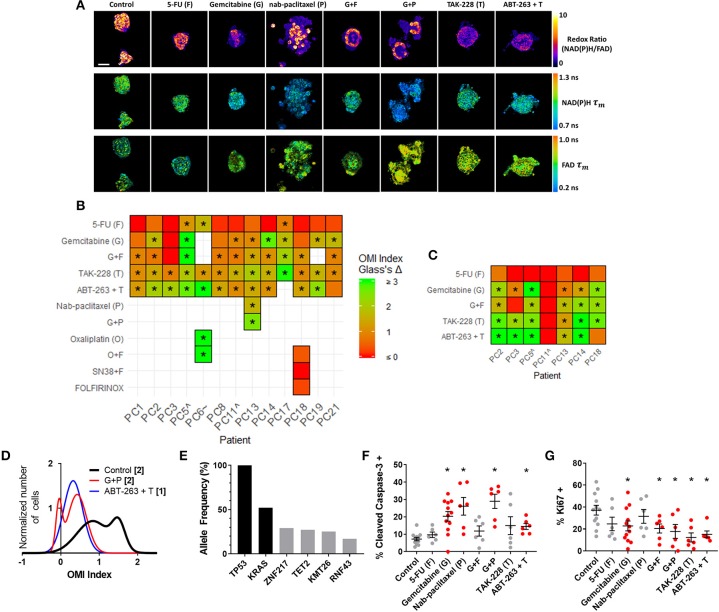
Figure 4.
OMI captures non-genetic cellular heterogeneity in pancreatic organoids. (A) Representative images of the redox ratio, NAD(P)H τm, and FAD τm, in organoids generated from Patient PC13 (anaplastic carcinoma of the pancreas), treated with standard chemotherapies and experimental targeted therapies for 72 h. Scale bar is 50 μm. (B,C) Heatmap representation of the OMI index treatment effect size (Glass's Δ) for all patients at 72 h in organoids (B) and fibroblasts cultured with organoids. (C) “∧” indicates the patient lesion was diagnosed as PanIN. “~” indicates the patient lesion was diagnosed as ampullary cancer. *Glass's Δ ≥ 0.75. (D) Normalized density distributions of the OMI index of individual cells contain subpopulations with G+P treatment, but not ABT-263 + T treatment after 72 h in PC13 organoids. Bracketed number indicates number of subpopulations. (E) High-depth targeted cancer gene sequencing of PC13 organoids. Allele frequencies of ~50% for KRAS and 100% for TP53 were found (black bars). Alterations with allele frequencies of 10–30% were detected (gray bars), but none of these alterations were pathogenic. (F) Cleaved caspase-3 staining of PC13 organoids shows differences in apoptosis between treatment conditions after 72 h of treatment. (G) Ki67 staining of PC13 organoids shows differences in proliferation between treatment conditions after 72 h. Each dot represents one organoid (mean ± SEM), and red indicates significant response to treatment. *p < 0.05 vs. control.

