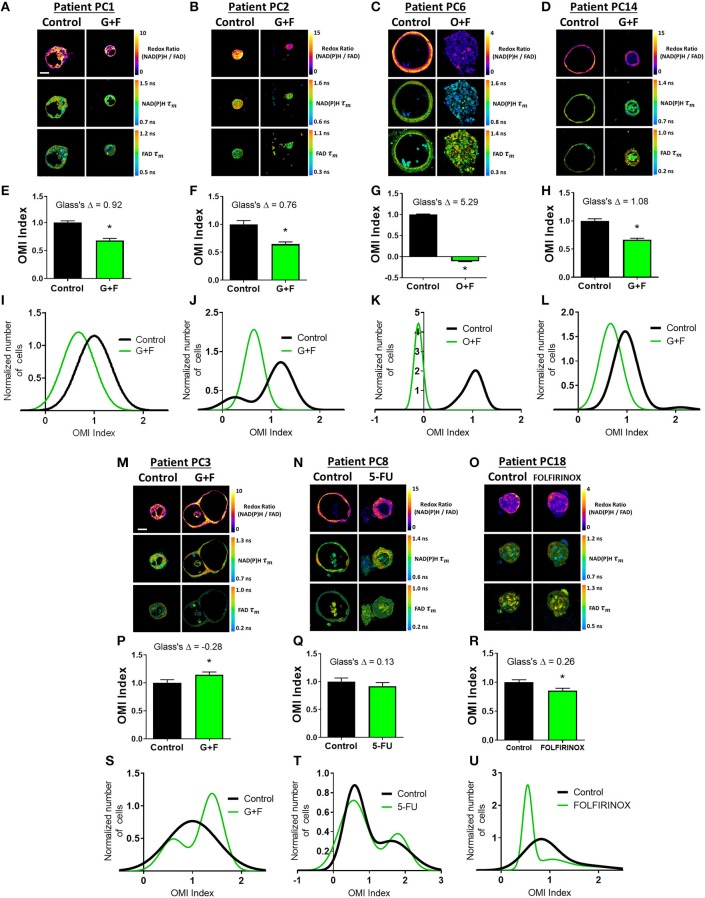
Figure 5.
Organoid-based predictions of pancreatic cancer patient response to therapy. (A–D) Representative redox ratio, NAD(P)H τm, and FAD τm images of pancreatic organoids from Patients PC1 (A), PC2 (B), PC6 (C), and PC14 (D), who are classified as predicted responders. Left columns indicate control organoids, and right columns indicate organoids treated with the same drugs as the patient adjuvant treatment. Scale bar is 50 μm. (E–H) The effect of the same drugs on the OMI index averaged across all cells in organoids derived from Patient PC1 (E), PC2 (F), PC6 (G), and PC14 (H). Error bars indicate mean ± SEM. *p < 0.0001. (I–L) Single-cell OMI index subpopulation analysis of treatment response in organoids from Patient PCI (I), PC2 (J), PC6 (K), and PC14 (L). (M–O) Representative redox ratio, NAD(P)H τm, and FAD τm images of pancreatic organoids from Patients PC3 (M), PC8 (N), and PC18 (O), who are classified as predicted non-responders. Left columns indicate control organoids, and right columns indicate organoids treated with the same drugs as the patient adjuvant treatment. (P–R) The effect of the same drugs on the OMI index averaged across all cells in organoids derived from Patient PC3 (P), PC8 (Q), and PC18 (R). (S–U) Single-cell OMI index subpopulation analysis of treatment response in organoids from Patient PC3 (S), PC8 (T), and PC18 (U).

