Figure 6.
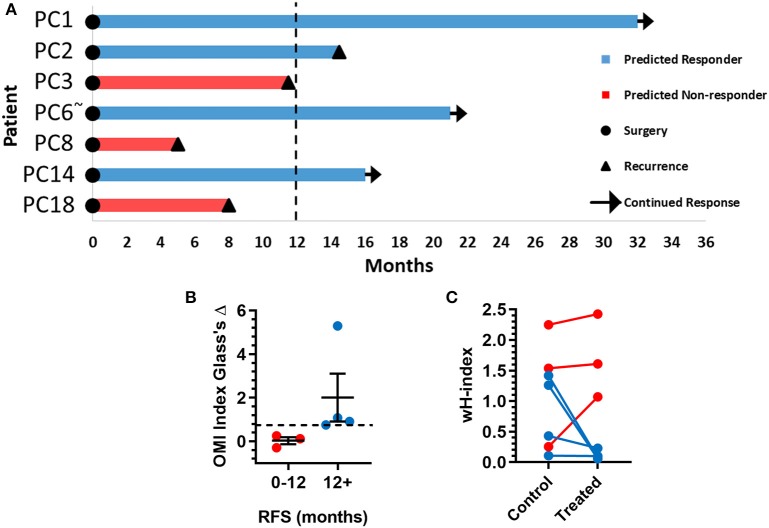
Pancreatic cancer patient clinical outcomes while on adjuvant therapy. (A) Swimmer plot indicating the number of months without recurrence following surgical resection of the tumor and adjuvant treatment. Patients are classified as predicted responders and non-responders based on organoid response profiles. Arrows indicate that the patient continues to survive without recurrence at the time of publication. “~” Indicates the patient's lesion was diagnosed as ampullary cancer. (B) Patients with RFS > 12 months had higher OMI index effect sizes at 72 h (Glass's Δ) than patients with RFS <12 months (mean± SEM). Dotted line represents proposed cutoff of Δ = 0.75. (C) Patients with RFS > 12 months show a decrease in wH-index with treatment compared to control organoids. Patients with RFS < 12 months show an increase in wH-index with treatment compared here to control organoids. Error bars not visible. N = 1,000 fits/group.

