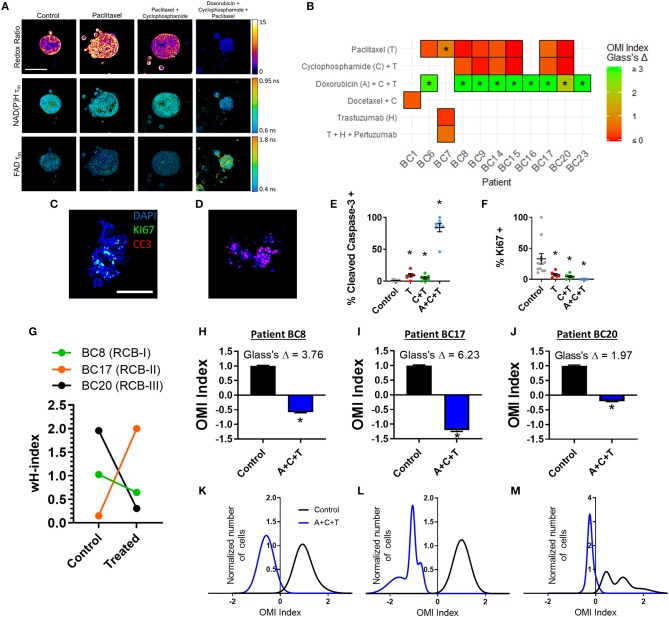
Figure 7.
OMI of single-cell treatment response in patient-derived breast tumor organoids. (A) Representative images of the optical redox ratio, NAD(P)H τm, and FAD τm organoids generated from Patient BC8 after 72 h of treatment. Scale bar = 100 μm. (B) Heatmap representation of the OMI index treatment effect size (Glass's Δ) at 72 h in organoids from each breast cancer patient. *Glass's Δ ≥ 0.75. 4-OOH cyclophosphamide (active metabolite) was used in place of cyclophosphamide. (C,D) Representative images of control (C) and A+C+T treated (D) BC8 organoids stained for Ki67 (green, proliferation), cleaved caspase-3 (red, apoptosis), and DAPI (blue, nuclei) after 72 h of treatment. Scale bar 100 μm. (E) Cleaved caspase-3 staining of organoids shows differences in apoptosis between treatment conditions after 72 h of treatment in BC8. (F) Ki67 staining of organoids shows differences in proliferation between treatment conditions after 72 h in BC8. Each dot represents one organoid (mean ± SEM). *p < 0.05 vs. control. (G) The effect of A+C+T treatment at 72 h on OMI index heterogeneity quantified by the wH-index in Patient BC8, BC17, and BC20 organoids. (H–J) The effect of 72 h A+C+T treatment on the OMI index averaged across all cells in organoids derived from Patient BC8 (H), BC17 (I), and BC20 (J). Error bars indicate mean ± SEM. *p < 0.0001. Single cell OMI index subpopulation analysis of 72 h of A+C+T treatment response in organoids from Patient BC8 (K), BC17 (L), and BC20 (M).

