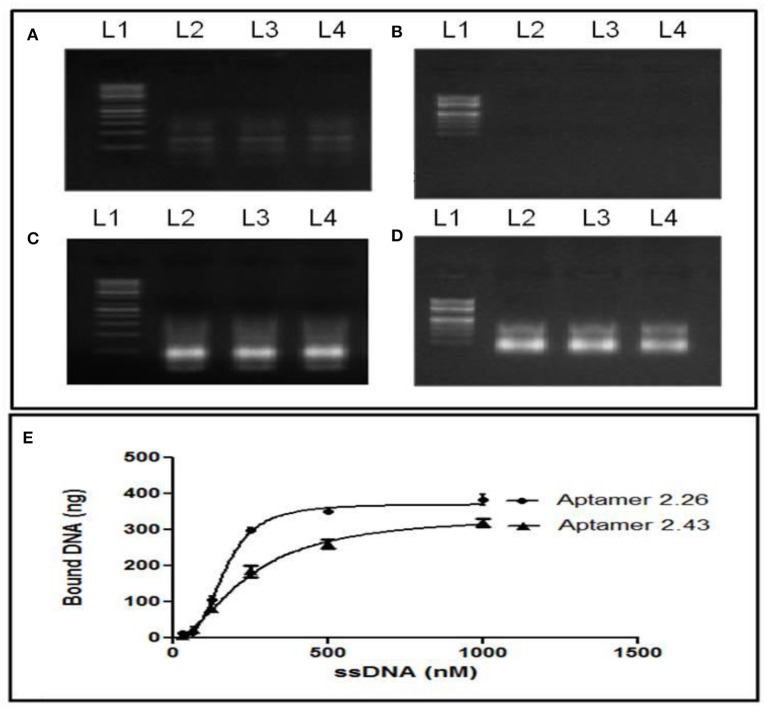
Figure 4.
Serum stability profiling: (A) PCR amplified DNA and (B) its single-stranded form before amplification, after treatment with 50%v/v normal human female serum. Effect of different salt concentrations on aptamer-CA125 binding: (C) negative controls and (D) treated aptamer (lane 1: ladder, lane 2: 0.2 M NaHCO3 with 0.5 M NaCl, lane 3: 100 mM NaCl and 5 mM MgCl2, lane 4: milli-Q water as positive control; (E) Binding—saturation curve for determination of KD. The original gel images have been provided in Figures S4, S5.

