
FIGURE 2.
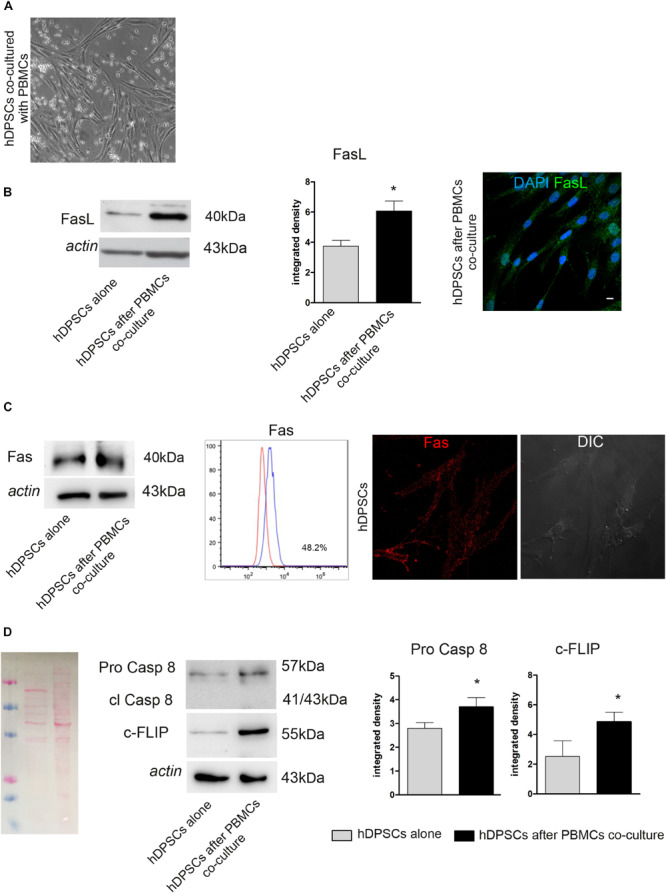
Evaluation of Fas/FasL pathway on both hDPSCs cultured alone and after co-culture with PBMCs. (A) Phase contrast image of hDPSCs cultured with PBMCs. (B) Western Blot analysis of FasL in both hDPSCs cultured alone and after co-culture with PBMCs. Histograms represent the mean ± SD (n = 3) of densitometry of FasL, *P < 0.05 hDPSCs after PBMCs co-culture vs hDPSCs cultured alone. The expression of FasL after co-culture with PBMCs was confirmed by confocal immunofluorescence analysis. Nuclei are counterstained with DAPI. Bar = 10 μm. (C) Western Blot analysis of Fas (CD95) in both hDPSCs cultured alone and after co-culture with PBMCs. FACS analysis confirms the positive expression of Fas in hDPSCs cultured alone. The expression of Fas on live hDPSCs cultured alone was also evaluated by Immunofluorescence analysis. DIC Image shows the morphological phenotype of hDPSCs. (D) Western blot analysis of pro-caspase 8, cleaved caspase 8 and c-FLIP performed on hDPSCs cultured alone and after co-culture with PBMCs. Actin bands were presented as control of protein loading; histograms represent mean ± SD, *P < 0.05 hDPSCs after PBMCs co-culture vs hDPSCs cultured alone.