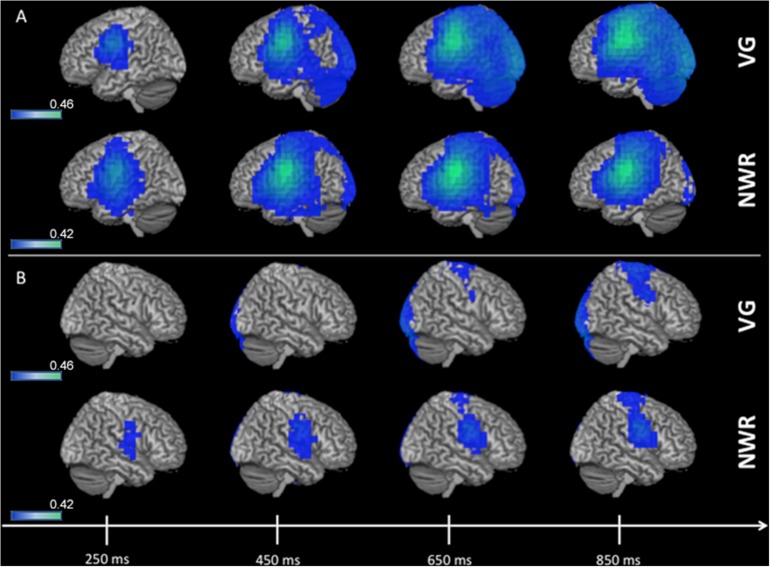
FIGURE 2.
3D overlay of average changes (reduction of beta power, in blue) during stimulus encoding (stimulus-locked) for both the verb generation (VG) and non-word repetition (NWR) tasks in the strong left group. Following auditory presentation of the stimulus, reduced beta power is observable over temporal and parietal regions in the left hemisphere (A) and, to a lesser extent, over right frontal regions (B). Individual beta power changes were spatially normalized to MNI space and averaged within each group for each condition. The group-averaged beta power changes were then thresholded at 25% of the absolute maximum F-value over the shown time course and displayed on 3D rendered brains in MNI space. Color bars are in pseudo-F values (in dB). Deep sources are not projected to the surface in this rendering.

