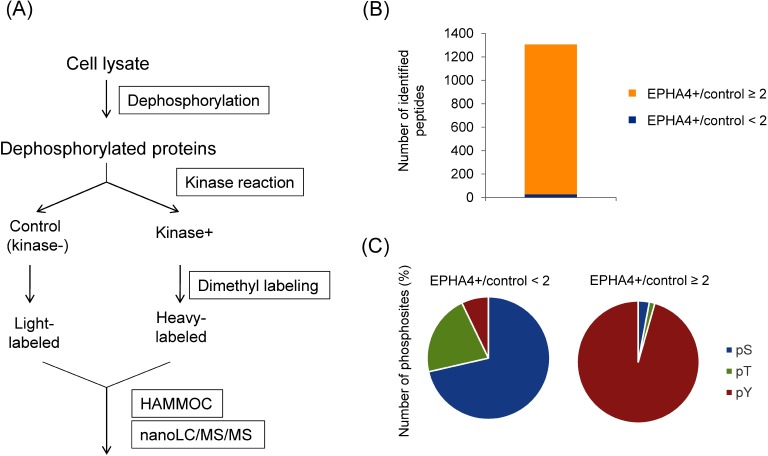
Fig. 3. Quantitative in vitro kinome profiling.
(A) Workflow of quantitative in vitro kinome profiling. Dephosphorylated cell lysate samples were individually reacted with 375 recombinant human protein kinases. Control (not treated with kinase) and kinase-treated samples were isotopically labeled and then analyzed by LC-MS/MS. Peak area ratios of kinase-treated (heavy-labeled) to controls (light-labeled) in all of the identified phosphopeptides were quantified by nanoLC-MS/MS. (B) Distribution of the peak area ratio in an in vitro assay with tyrosine kinase EPHA4. The number of identified monophosphorylated peptides with peak area ratios (EPHA+/control) greater than or equal to 2 and less than 2 are shown highlighted in yellow and blue, respectively. (C) The number of phosphorylated serine, threonine and tyrosine residues obtained by the in vitro reaction with EPHA4. Most of the identified phosphosites with a peak area ratio ≥2 were phosphotyrosines, which reflect the substrate preference of the tyrosine kinase EPHA4. In contrast, phosphosites showing a peak area ratio <2 were derived from inherent phosphopeptides that were not dephosphorylated by the phosphatase treatment.

