. 2020 Mar 17;9(1):A0080. doi: 10.5702/massspectrometry.A0080

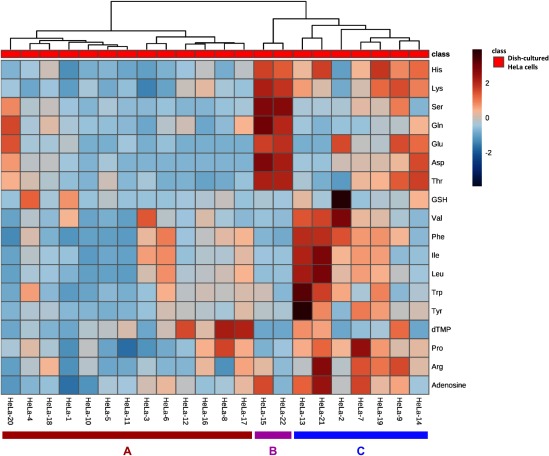
Fig. 5. HCA results for 22 single HeLa cells using peak areas of the detected metabolites. The horizontal axis indicates single-cell samples (HeLa-1–HeLa-22) and the vertical axis indicates metabolites. The HCA conditions were as follows: distance, Euclidean; clustering algorithm, Ward; and metabolome data, mean-centered and divided by the standard deviation of each variable.

Fig. 5. HCA results for 22 single HeLa cells using peak areas of the detected metabolites. The horizontal axis indicates single-cell samples (HeLa-1–HeLa-22) and the vertical axis indicates metabolites. The HCA conditions were as follows: distance, Euclidean; clustering algorithm, Ward; and metabolome data, mean-centered and divided by the standard deviation of each variable.