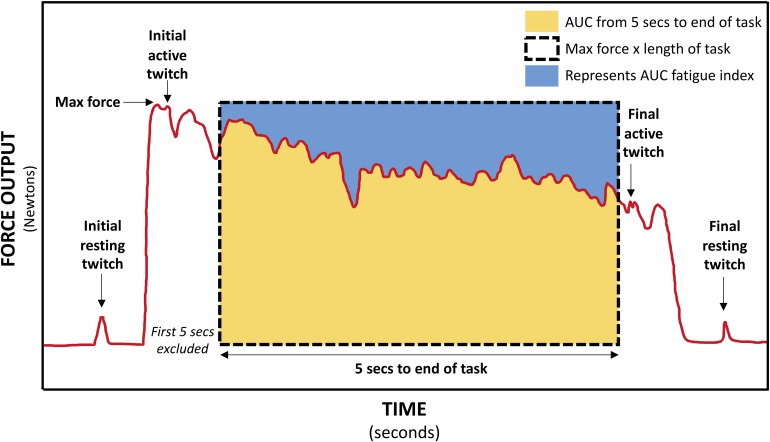
FIGURE 4.
Schematic of force trace during 30-s MVIC showing muscle twitches applied for calculation of voluntary activation (VA), central fatigue, and peripheral fatigue, and the areas used to calculate the area under curve (AUC) fatigue index (represented by the blue area above the force–time curve).

