
Figure 1.
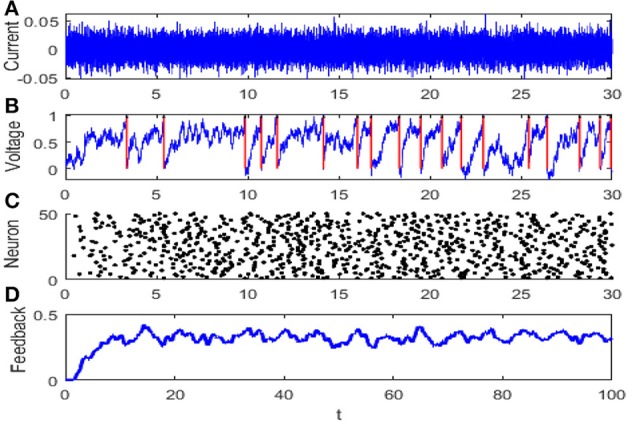
The evolution diagram of the integrate-and-fire neuron network: (A) diffusion approximation transforming the synaptic current with r = 1, (B) membrane potential of neuron where the red arrow denotes the discharge time, (C) raster plot of the network where every node denotes a spike at a corresponding time and neuron, and (D) feedback of the network. The parameters are set as μ = 0.8, VT = 1, VR = 0, G = 0.5, ε = 0.1, Ω = 1, τS = 0.5, τD = 1, τref = 0, and N = 50.