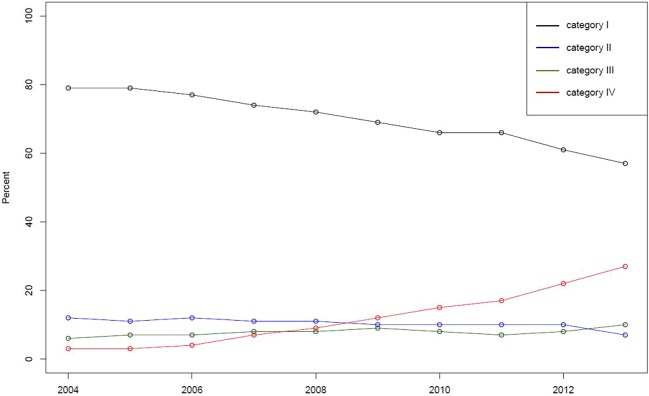
Figure 2.
Proportion of frequently prescribed users over time sorted by four categories based on the proportion of disposable forms in prescriptions. Note: Category I indicates the group in which the proportion using disposable forms is less than one-quarter. Category II indicates the proportion between one-quarter and one-half. Category III indicates the proportion between one-half and three-fourths. Category IV indicates the proportion more than three-quarters.

