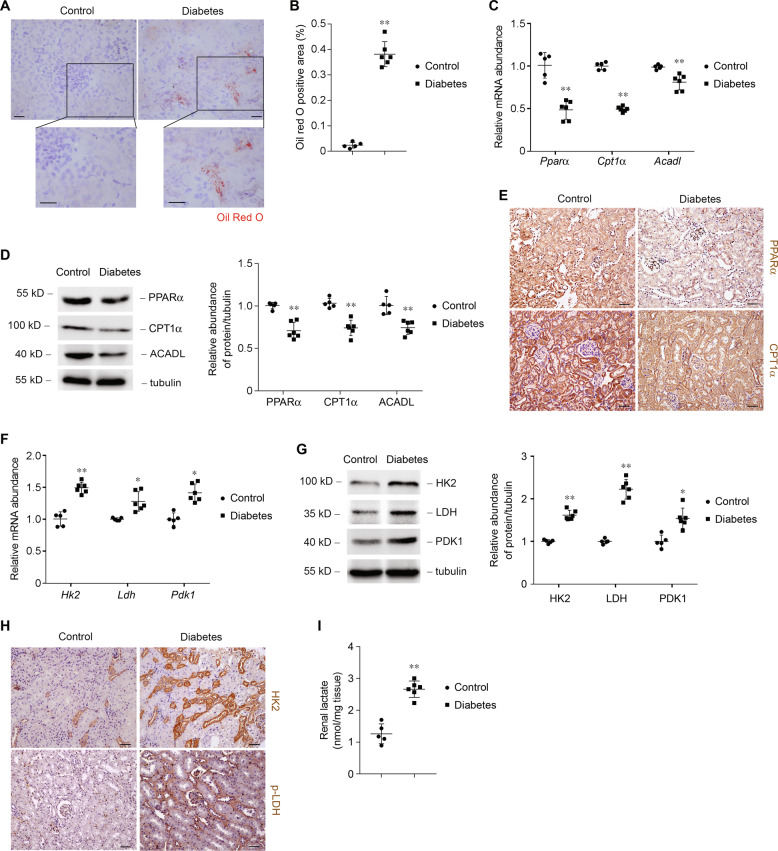
Fig. 2. Animal model of diabetic kidney disease demonstrate a metabolic switch from fatty acid oxidation to glycolysis.
a Representative images of mice kidney sections from control and diabetic mice with Oil Red O staining. Scale bars, 50 μm. b Quantification of Oil Red O-positive area in kidney samples from control (n = 5) and diabetic mice (n = 6). **p < 0.01 compared with control. c Relative mRNA levels of genes related to FAO (Pparα, Cpt1α, and Acadl) in control samples and samples from diabetic mice. ** p < 0.01 compared with control. d Western blot analysis of proteins related to FAO and relative protein expression levels in control samples and samples from diabetic mice. **p < 0.01 compared with control. e Representative images of mouse kidney sections from control and diabetes with immunostaining for PPARα and CPT1α. Scale bars, 50 μm. f Relative mRNA levels of genes related to glucose utilization in control samples and samples from diabetic mice. *p < 0.05 compared with control. **p < 0.01 compared with control. g Western blot analysis of proteins related to glucose utilization and relative protein expression levels in control samples and samples from diabetic mice. *p < 0.05 compared with control. **p < 0.01 compared with control. h Representative images of mouse kidney sections from control and diabetes with immunostaining for HK2 and p-LDH. Scale bars, 50 μm. i Quantification of lactate in kidney tissue samples from control and diabetic mice. **p < 0.01 compared with control.

