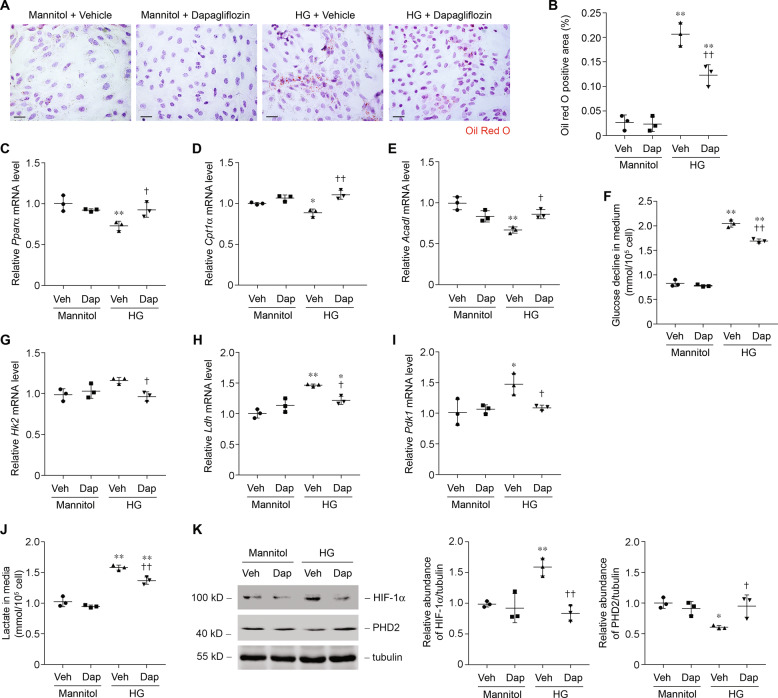
Fig. 7. Dapagliflozin treatment prohibits high glucose (HG)-induced metabolic switch in primary tubular epithelial cells (PTCs).
a Representative images of PTCs incubated with glucose (30 mmol/l) for 24 h in the presence or absence of dapagliflozin (2 μmol/l) with Oil Red O staining. Scale bars, 25 μm. b Quantification of Oil Red O-positive area in PTCs incubated with glucose for 24 h in the presence or absence of dapagliflozin. n = 3 experiments. **p < 0.01 compared to control; ††p < 0.01 compared with HG + vehicle. c–e Relative mRNA levels of Pparα (c), Cpt1α (d), and Acadl (e) in PTCs incubated with glucose for 6 h in the presence or absence of dapagliflozin. *p < 0.05 compared with control; **p < 0.01 compared with control; †p < 0.05 compared with HG + vehicle. ††p < 0.01 compared with HG + vehicle. f Glucose decline in medium of PTCs incubated with glucose for 24 h in the presence or absence of dapagliflozin. **p < 0.01 compared with control; ††p < 0.01 compared with HG + vehicle. g–i Relative mRNA levels of Hk2 (g), Ldh (h), and Pdk1 (i) in PTCs incubated with glucose for 6 h in the presence or absence of dapagliflozin. *p < 0.05 compared with control; **p < 0.01 compared with control; †p < 0.05 compared with HG + vehicle. j Quantification of lactate in culture medium of PTCs incubated with glucose for 24 h in the presence or absence of dapagliflozin. **p < 0.01 compared with control; ††p < 0.01 compared with HG + vehicle. k Western blot analysis of HIF-1α and PHD2 protein and relative protein expression level in PTCs incubated with glucose for 6 h in the presence or absence of dapagliflozin. *p < 0.05 compared with control; **p < 0.01 compared with control; †p < 0.05 compared with HG + vehicle; ††p < 0.01 compared with HG + vehicle.

