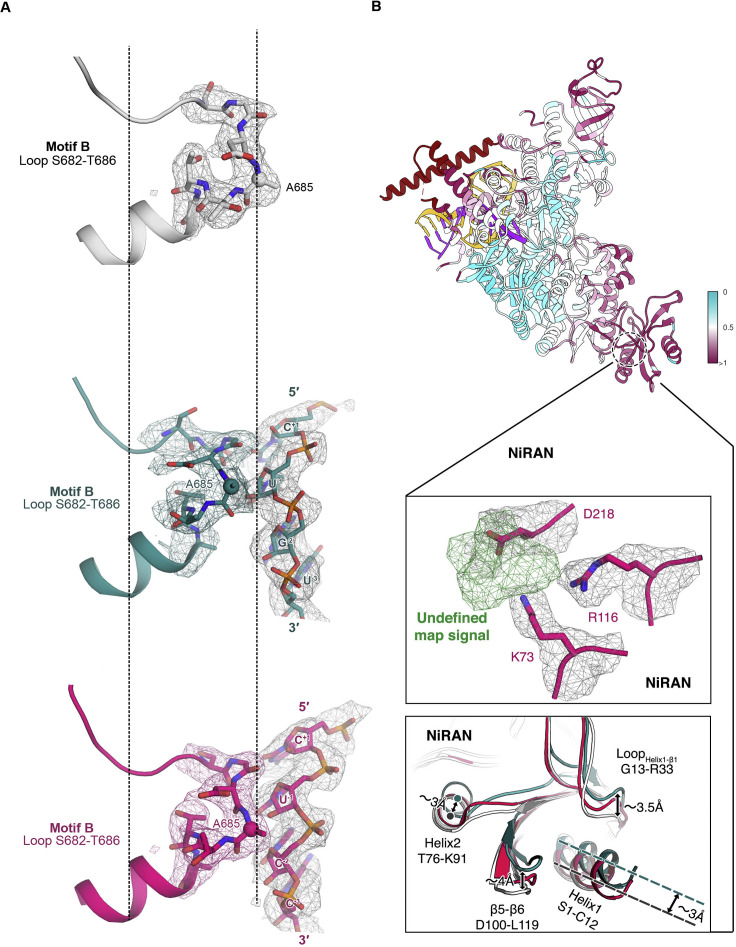
Figure S5.
Structural Variations and corresponding cryo-EM map in NiRAN and motif B among Apo and Catalytic Complexes, related to Figure 4
Pre-translocated complex in red; post-translocated complex in dark green; apo complex in white.
(A) The experimental cryo-EM map is superimposed by structural rearrangements of motif B on Palm. Three states are aligned by helix after loop S682 to T686 and residue A685 (shown as black dash lines).
(B) The pre-translocated complex is colored according to the root mean square deviation (RMSD) which measures the average distance in Å between the C-alpha atoms of the three aligned complexes(top). An extra undefined map signal (in green) in NiRAN is indicated under an unambiguous experimental cryo-EM map signal. Surrounding residues are shown in sticks and cartoons with the same threshold level (middle). Structural rearrangements of NiRAN are indicated (bottom).

