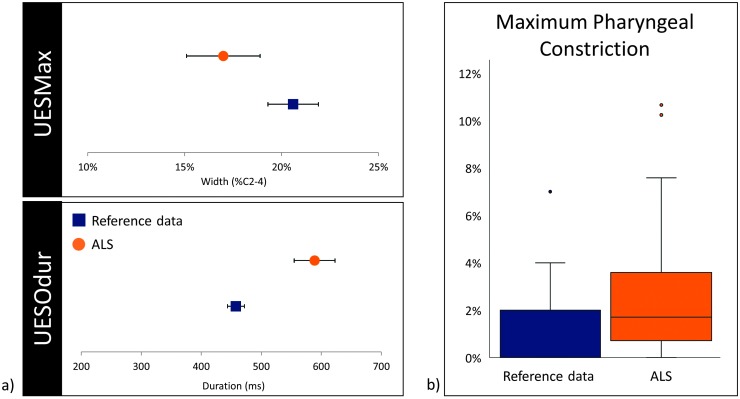
Figure 4.
(a) Error plots displaying means and 95% confidence intervals for UESMax (top) and UESOdur (bottom), compared to healthy reference data. (b) Box and whisker plots comparing distribution of pharyngeal constriction area between healthy reference data and ALS cohort; extreme outliers (> 12.9% C2–42) are not displayed. UES = upper esophageal sphincter; UESMax = diameter of UES opening; UESOdur = UES opening duration; ALS = amyotrophic lateral sclerosis.

 This work is licensed under a