
Figure 10.
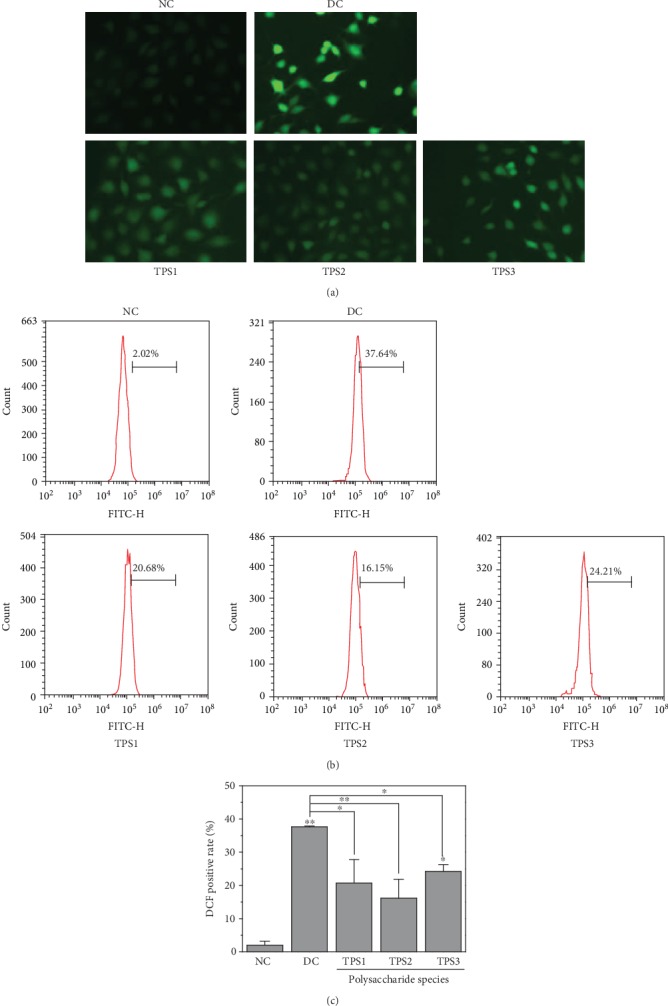
ROS changes in HK-2 cells before and after TPS protection. (a) Fluorescence microscopy images. (b) Flow cytometry quantitative analysis of fluorescence intensity. (c) Quantitative fluorescence intensity of ROS. c(TPS) = 80 μg/mL. The experimental conditions and statistical significance are the same as Figure 8.