
Figure 2.
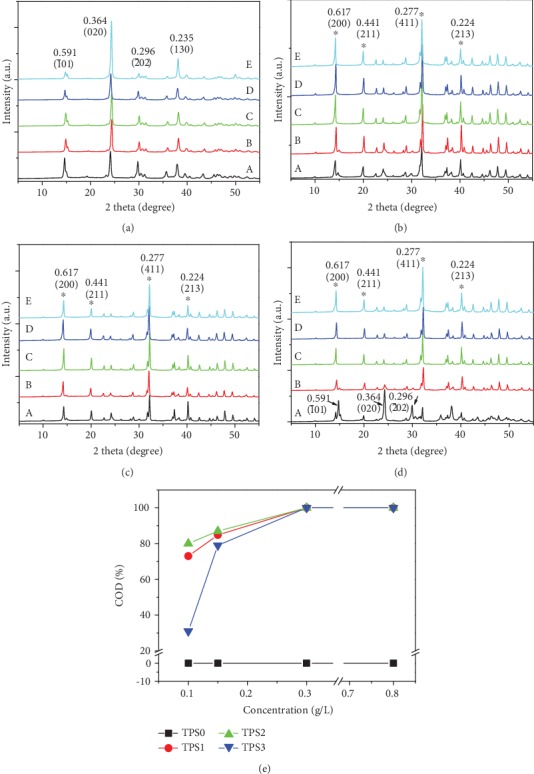
XRD patterns of CaOx crystals and COD content induced by different concentrations of TPSs. (a) TPS0. (b) TPS1. (c) TPS2. (d) TPS3. (e) Percentage of COD. c(TPS): (A) 0, (B) 0.1, (C) 0.15, (D) 0.3, (E) 0.8 g/L. c(Ca2+) = c(Ox2−) = 10 mmol/L; crystallization time: 2 h.