
Figure 3.
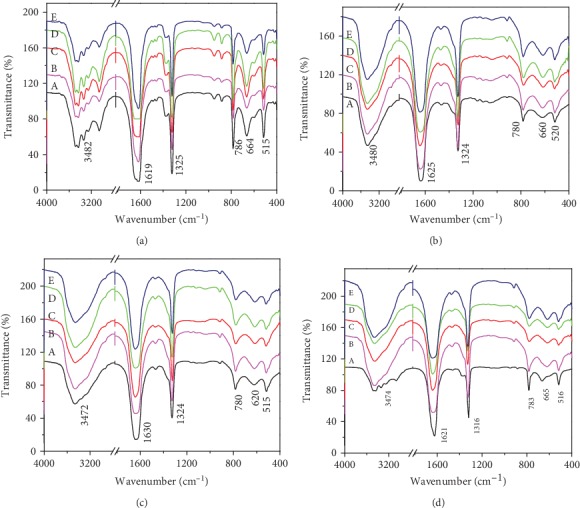
FT-IR spectra of CaOx crystals induced by different concentrations of TPSs. (a) TPS0. (b) TPS1. (c) TPS2. (d) TPS3. c(TPS): (A) 0, (B) 0.1, (C) 0.15, (D) 0.3, and (E) 0.8 g/L.
Official websites use .gov
A
.gov website belongs to an official
government organization in the United States.
Secure .gov websites use HTTPS
A lock (
) or https:// means you've safely
connected to the .gov website. Share sensitive
information only on official, secure websites.
FT-IR spectra of CaOx crystals induced by different concentrations of TPSs. (a) TPS0. (b) TPS1. (c) TPS2. (d) TPS3. c(TPS): (A) 0, (B) 0.1, (C) 0.15, (D) 0.3, and (E) 0.8 g/L.