
Figure 1.
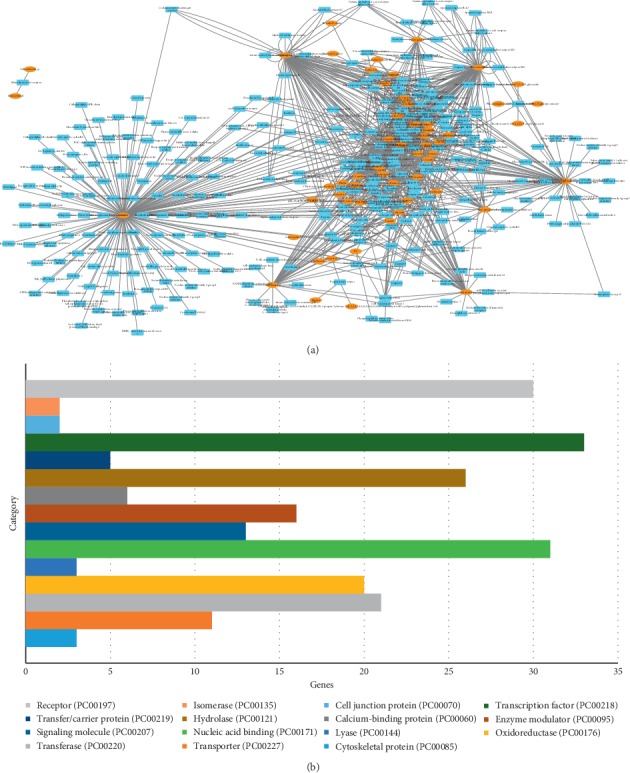
The C-T network of MHC and the targets class. (a) The compound in MHC and the potential target network. Different colors represent the nodes with different attributions. Yellow nodes represent the candidate compounds; blue represent the predicted targets. (b) The distribution of the candidate targets.