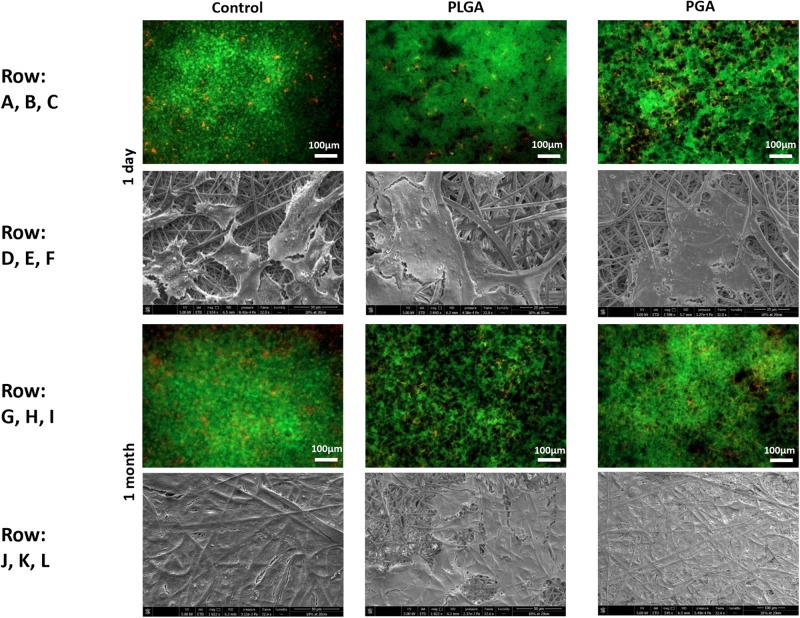
FIGURE 11.
Representative images of live/dead staining (green/red) and corresponding SEM micrographs of ARPE-19 cells after 1 day’s culture (A–F), 1 month’s culture (G–L) on membrane only control, or with either PLGA or PGA nanoparticles decorated on the basal side of the membrane. Live/dead images show there is little difference between the three conditions with few dead cells present up to 1 month’s culture. SEM micrographs show the progression in cells covering the membrane’s apical surface (n = 3).

