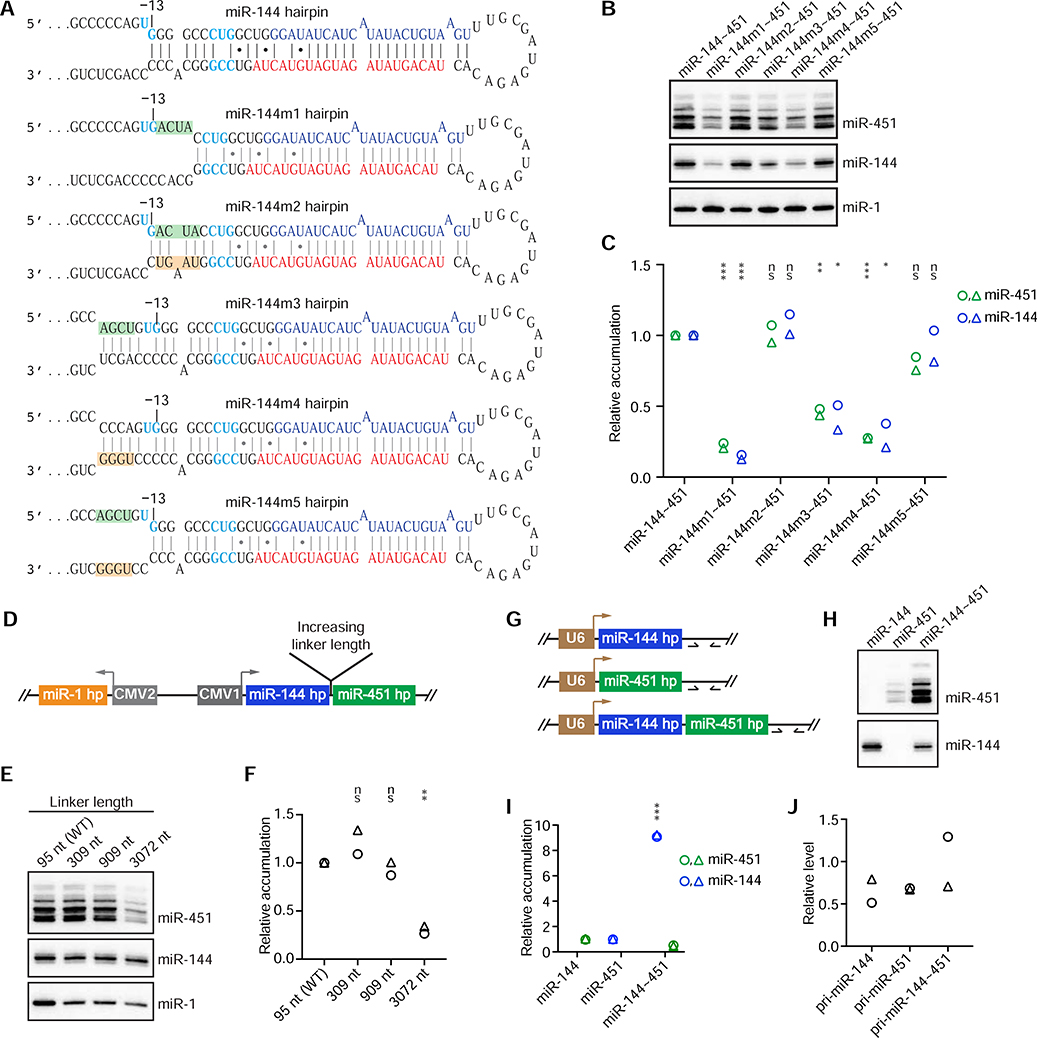
Figure 3. Further Characterization of Cluster Assistance.
(A) The miR-144 wild-type and mutant hairpins (m1–5) designed to test whether cluster assistance depends on efficient recognition of the helper hairpin. Mutations introduced in the basal stem of the miR-144 hairpin are shaded by green and orange boxes. Otherwise, this panel is as in Figure 1B.
(B) Northern-blot analysis of miRNA accumulation from the indicated expression cassettes that encoded derivatives of the miR-144 hairpin shown in (A).
(C) Quantification of (B) and its biological replicate (circles and triangles, respectively). For each lane, mature miRNA levels were first normalized to that of miR-1 and then to the levels from the miR-144~451 construct. Statistically significant or non-significant (ns) changes of miR-144 or miR-451 levels compared with levels for the wild-type cluster are indicated (***p < 0.001, **p < 0.01, *p < 0.05, unpaired two-tailed t test).
(D) Schematic of the expression cassettes used in (E) to test the sensitivity of cluster assistance to the spacing of the two hairpins. Otherwise, this panel is as in Figure 1C.
(E) Northern-blot analyses of miRNA accumulation from expression cassettes that had sequences of the indicated lengths linking the miR-144 and miR-451 hairpins (wild-type, WT).
(F) Quantification of (E) and its biological replicate (circles and triangles, respectively). For each lane, the level of miRNA-451 was normalized to that of miR-144, and the level from the WT sample was set to 1. This normalization provided a conservative quantification of cluster assistance at longer linker lengths; if normalizing instead to miR-1 levels, then miR-451 expression from the construct with a 3072 nt linker would have equaled that from the construct with the WT linker.
(G) Schematics of the expression cassettes used in (H) to test whether cluster assistance requires Pol II transcription. U6 indicates the U6 promoter. Arrows downstream of the miRNA hairpins indicate qPCR primers used to assay pri-miRNA expression.
(H) Northern-blot analysis of miRNA accumulation from the indicated U6-driven expression cassettes of (G).
(I) Quantification of (H) and its biological replicate (circles and triangles, respectively). Mature miRNA levels from the individually expressed cassettes (mean of two replicates) were set to 1.
(J) RT-qPCR analysis of pri-miRNA expression in Drosha-knockout cells, using primers indicated in (G). GAPDH mRNA was used as an internal control, and the average level of pri-miR-144~451 was set to 1. Shown is quantification of the two biological replicates (circles and triangles); no statistically significant difference was observed (p > 0.05, t test).

